

In the ever-shifting landscape of cryptocurrency exchange-traded funds, the 21Shares Polkadot Trust ETF (TDOT) stands out as a fresh vehicle for investors eyeing Polkadot's native token, DOT. Launched on NASDAQ on March 6,2026, this Polkadot ETF TDOT has navigated early volatility, with its current price settling at $14.81 after a 24-hour dip of $0.3791, or -2.49%. The day's range swung from a high of $14.88 to a low of $14.56, underscoring the TDOT ETF performance 2026 challenges amid broader market pressures.
TDOT's Rocky Launch Amid DOT's Supply Overhaul
The 21Shares Polkadot Trust ETF debuted with high expectations, seeded by roughly $11 million and boasting a competitive management fee of 0.30%. Its goal is straightforward: mirror the CME CF Polkadot Dollar Reference Rate to deliver precise exposure to DOT without the hassles of direct custody. Yet, reality bit hard post-launch. As of early March, the fund's net asset value hovered around $18.48, with assets under management at $11,459,445.77. Fast forward to today, and TDOT trades at $14.81, reflecting DOT's own turbulent path and investor hesitation in a stagnant crypto winter.
Polkadot itself underwent a pivotal shift with a 53.6% issuance cut, slashing annual supply to 56.88 million tokens and imposing a 2.1 billion hard cap. This move aims to foster scarcity, potentially bolstering long-term value. For 21Shares Polkadot Trust holders, it's a double-edged sword: scarcity could ignite rallies, but short-term sentiment remains muted. I've watched similar supply dynamics play out in other networks; Polkadot's execution here demands disciplined patience from ETF investors.
Polkadot's supply mechanics just got a serious upgrade - issuance down 53.6%, hard cap at 2.1B. How will this reshape DOT's trajectory in 2026?
Decoding DOT Spot ETF Flows: Cautious Capital Inflows
DOT spot ETF flows into TDOT have been modest since inception, a far cry from the frenzy seen in Bitcoin or Ethereum counterparts. Data points to incremental inflows mirroring cautious optimism rather than exuberance. In a market downturn, this Polkadot ETF NASDAQ listing has attracted sidelined capital seeking layered blockchain exposure, yet volumes trail expectations. Today's $14.81 price level tests early holders, with 24-hour losses amplifying the need for flow transparency.
From my cross-market vantage, TDOT's flow story hinges on Polkadot's ecosystem momentum. Relay chain upgrades and parachain auctions continue to draw developers, but retail and institutional appetite lags. Seeded AUM provided a sturdy base, yet sustaining inflows requires DOT stabilizing above key supports. At $14.81, we're at a pivot; sustained buying could signal the turn.
Contrast this with Polkadot's fundamentals: the issuance reduction not only curbs dilution but aligns incentives for stakers. ETF structures like TDOT amplify this by offering regulated access, sidestepping wallet woes. Still, with YTD returns flat at inception benchmarks, investors weigh the 0.30% fee against heightened volatility risks. Not registered under the 1940 Act, TDOT carries explicit warnings - a reminder that crypto ETFs demand adaptable strategies.
21Shares Polkadot Trust ETF (TDOT) Price Prediction 2027-2032
Forecasts based on DOT trends, ETF flows, Polkadot scarcity measures, and market analysis as of April 2026 (Current price: $14.81)
| Year | Minimum Price | Average Price | Maximum Price | YoY Growth (Avg from Prev) |
|---|---|---|---|---|
| 2027 | $12.00 | $21.00 | $36.00 | +41.6% |
| 2028 | $16.50 | $29.50 | $52.00 | +40.5% |
| 2029 | $23.00 | $41.50 | $76.00 | +40.7% |
| 2030 | $31.00 | $57.50 | $110.00 | +38.6% |
| 2031 | $41.00 | $78.00 | $155.00 | +35.7% |
| 2032 | $54.00 | $105.00 | $210.00 | +34.6% |
Price Prediction Summary
TDOT is projected to show strong growth through 2032, with average prices climbing from $21 in 2027 to $105 by 2032, reflecting Polkadot's enhanced scarcity, ETF inflow acceleration, and crypto market recovery. Min/Max ranges capture bearish volatility (e.g., regulatory hurdles) and bullish surges (e.g., parachain expansion).
Key Factors Affecting 21Shares Polkadot Trust ETF Stock Price
- Polkadot's 53.6% issuance cut and 2.1B DOT hard cap boosting scarcity
- Modest initial ETF inflows expected to grow with institutional adoption
- DOT network upgrades, parachain ecosystem expansion, and interoperability advantages
- Broader crypto bull market cycles and Bitcoin/ETH ETF momentum spillover
- Favorable U.S. regulatory environment for crypto ETFs post-2026 launches
- Macro factors like declining interest rates and economic recovery supporting risk assets
Disclaimer: Stock price predictions are speculative and based on current market analysis. Actual prices may vary significantly due to market volatility, economic conditions, and other factors. Always do your own research before making investment decisions.
Charting TDOT's Technical Footprint in 2026
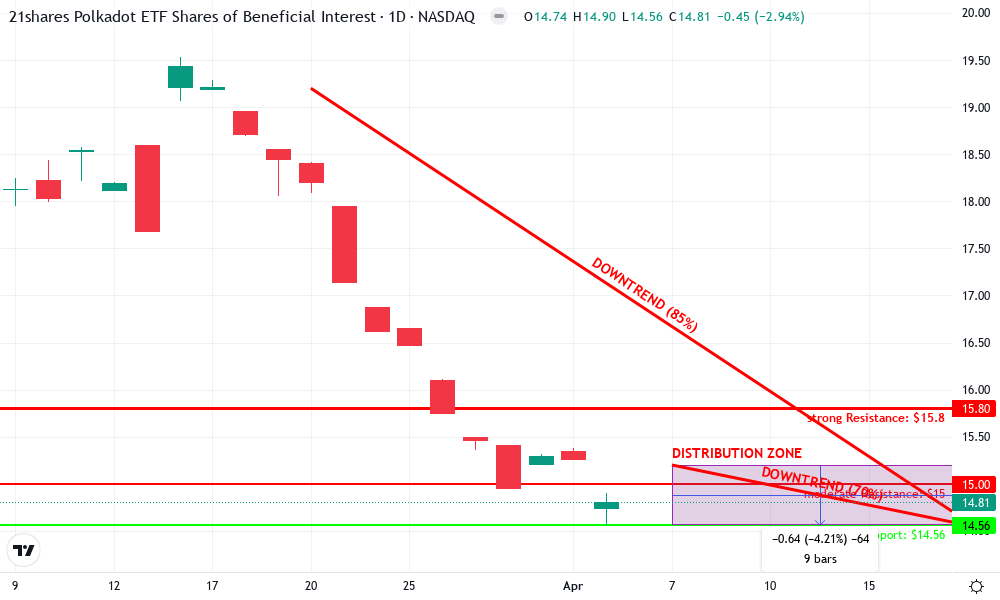
Technically, TDOT's chart echoes DOT's broader consolidation. From launch highs near $18, the ETF has retraced sharply to $14.81, flirting with 24-hour lows of $14.56. Volume spikes on down days suggest distribution, but oversold indicators hint at rebound potential. As a strategist blending macro overlays with price action, I see $14.81 as a make-or-break zone; defense above the session low preserves upside toward $15.50 resistance.
Polkadot's network health bolsters the case. With reduced issuance, staking yields adjust favorably, indirectly supporting TDOT's tracking fidelity. Yet, in a macro environment favoring treasuries over tokens, TDOT ETF performance 2026 reflects this tension. Inflows, though tepid, provide a floor; any acceleration could catalyze a breakout.
Layering in on-chain metrics reveals why TDOT's $14.81 perch feels precarious yet promising. Polkadot's parachain activity remains robust, with over 50 live chains processing millions in daily transactions. This underpins DOT's utility, even as the token grapples with macro headwinds like persistent inflation fears elsewhere in crypto. For 21Shares Polkadot Trust investors, the ETF's tight tracking - deviations under 0.5% historically - means DOT's fate is theirs. I've advised clients to view TDOT not as a quick flip, but as a stake in interoperability's future.
Key TDOT Metrics
| Metric | Value |
|---|---|
| Current Price | $14.81 |
| 24h Change | $-0.38 (-2.49%) |
| 24h High | $14.88 |
| 24h Low | $14.56 |
| AUM | $11.46M |
| Launch NAV | $18.48 |
| YTD Return | 0.00% |
| Management Fee | 0.30% |
Navigating Risks in the Polkadot ETF Arena
Every ETF launch carries baggage, and TDOT's no exception. Unregistered under the Investment Company Act of 1940, it sidesteps some oversight, exposing holders to amplified volatility. DOT's price swings - from launch euphoria to today's $14.81 reality - mirror this. Custody risks loom large; while 21Shares employs institutional-grade cold storage, black swan events like exchange hacks linger in memory. Add regulatory flux: SEC scrutiny on altcoin ETFs could cap DOT spot ETF flows, pressuring AUM growth.
Yet, discipline tempers fear. The 0.30% fee undercuts competitors, and Polkadot's issuance cap injects scarcity absent in inflationary peers. Staking rewards, proxied through the ETF, offer yields around 14% annualized pre-cut, now recalibrating higher. In my hybrid analysis, TDOT shines for diversified portfolios - 5-10% allocation balances risk without overexposure. At $14.81, with 24-hour lows at $14.56, dip-buyers eye value; but oversold RSI below 30 screams caution to the impatient.
TDOT at $14.81: Scarcity tailwinds meet macro storms. Holders, adapt or fade.
Strategic Plays for TDOT in 2026
Positioning for Polkadot ETF NASDAQ upside demands adaptability. Scale in on weakness: target $14.56 lows for entries, trail stops at 5% below $14.81. Pair with macro hedges - gold ETFs offset token beta. Watch flows closely; breaching $15M AUM sparks momentum. Polkadot's JAM upgrade, slated mid-year, could supercharge relay chain throughput, lifting DOT and TDOT alike. I've seen supply shocks ignite 2-3x runs in similar setups; 2026 holds that potential if inflows awaken.
Compare TDOT to DOT direct: ETF premiums hover near zero, ensuring parity. But for tax-advantaged accounts, TDOT streamlines the game. Institutions, deterred by KYC hurdles in spot trading, funnel here - modest inflows signal early adoption. As cross-market flows normalize, expect rotation from BTC/ETH saturation into alt-L1s like Polkadot.
21Shares Polkadot Trust ETF Technical Analysis Chart
Analysis by Lucas Bennett | Symbol: NASDAQ:TDOT | Interval: 1D | Drawings: 7
Technical Analysis Summary
Lucas Bennett here with a balanced hybrid analysis for TDOT's nascent chart post-launch. Draw a steep downtrend line connecting the swing high on 2026-03-20 at $19.20 to the recent swing low on 2026-04-18 at $14.60, extending forward with 85% confidence. Add horizontal resistance at $15.80 (prior consolidation high, strong) and support at $14.56 (24h low, moderate). Overlay Fib retracement from 2026-03-17 low (~$17.50) to 2026-03-20 high ($19.20), highlighting 61.8% retracement near $14.81 current price. Mark volume spikes on down days (e.g., 2026-04-12) with red arrow_mark_down callouts noting bearish divergence. Draw a date_price_range rectangle for distribution zone 2026-04-07 to 2026-04-18 between $14.56-$15.20. Add text annotations for MACD bearish crossover around 2026-04-10 and potential entry long at support with stop below $14.30. Use arrow_mark_up for cautious bounce potential if holds $14.56.
Risk Assessment: medium
Analysis: High volatility inherent to new crypto ETF, downtrend intact but near support; hybrid view tempers with DOT fundamentals
Lucas Bennett's Recommendation: Monitor $14.56 hold for low-risk long setup; avoid chasing downside in medium tolerance portfolio—patience key.
Key Support & Resistance Levels
📈 Support Levels:
- $14.56 - 24h low and recent candle lows cluster; potential bounce zone if volume dries up moderate
- $14 - Psychological round number and channel lower bound weak
📉 Resistance Levels:
- $15 - Recent swing high and Fib 38.2% retracement moderate
- $15.8 - April consolidation ceiling, prior volume shelf strong
Trading Zones (medium risk tolerance)
🎯 Entry Zones:
- $14.56 - Support confluence with oversold potential post-distribution; align with DOT scarcity narrative medium risk
- $14.81 - Current price pullback entry on MACD divergence confirmation high risk
🚪 Exit Zones:
- $15.5 - Profit target at resistance retest 💰 profit target
- $14.3 - Stop loss below channel support 🛡️ stop loss
- $16.2 - Stretch target on breakout 💰 profit target
Technical Indicators Analysis
📊 Volume Analysis:
Pattern: Increasing on down candles, bearish (e.g., spikes 2026-04-12/18), low on greens
Confirms selling pressure, no accumulation yet; watch for climax
📈 MACD Analysis:
Signal: Bearish crossover mid-April, histogram expanding negative
Momentum aligns with price downtrend, divergence possible at lows
Applied TradingView Drawing Utilities
This chart analysis utilizes the following professional drawing tools:
Disclaimer: This technical analysis by Lucas Bennett is for educational purposes only and should not be considered as financial advice. Trading involves risk, and you should always do your own research before making investment decisions. Past performance does not guarantee future results. The analysis reflects the author's personal methodology and risk tolerance (medium).
Zoom out, and TDOT embodies crypto's maturation. From wild-west tokens to NASDAQ tickers, it's progress. Current $14.81 levels test resolve, but Polkadot's developer moat - 1,200 and active builders - fortifies the thesis. Flows may lag, yet scarcity and utility converge. Investors blending patience with precision will harvest the upside as 2026 unfolds.




No comments yet. Be the first to share your thoughts!