
As Ethereum hovers at $1,940.01, down 2.66% in the last 24 hours with a low of $1,927.72 and high of $2,035.08, on-chain activity tells a story of robust demand amid volatility. Daily transactions exceed 2.3 million, active addresses top 995k, and staking approaches 36 million ETH. Spot Ethereum ETFs amplify this, with BlackRock’s ETHA holding 3 million ETH worth nearly $9 billion after a $1.74 billion single-day inflow. For 2026 investors, the choice between spot ETFs and direct ETH buys hinges on on-chain metrics revealing liquidity flows, whale maneuvers, and yield dynamics.

On-Chain Surge Driven by DeFi and Institutional Inflows
Ethereum’s network processed over 2.9 million transactions recently, fueled by DeFi protocols, stablecoin volumes, and smart contract calls. Active addresses at 995k signal broad participation, while 36 million ETH staked generates yields above 4%. Spot ETF inflows, totaling $474.6 million in four days, correlate directly with this uptick; institutional buys via ETFs create custodial demand without flooding spot markets.
Contrast this with direct ETH accumulation: whales dumped 3.8 million ETH, offsetting $13.82 million ETF inflows on select days. Net effect? Conflicting pressures keep price pinned near $1,940.01. Tools like Glassnode and Nansen track these flows, showing ETF shares as non-circulating supply, reducing sell-side liquidity by 0.5-1% of float.
ETF Mechanics vs Spot Holdings: Custody and Liquidity Breakdown
Ethereum spot ETFs bundle ETH into shares traded on traditional exchanges, appealing to 401(k)s and IRAs barred from self-custody. BlackRock’s ETHA exemplifies this, amassing 3 million ETH custodied off-chain. On-chain footprint? Minimal direct activity, as authorized participants (APs) handle creations/redemptions via arbitrage, not retail trades. This insulates price from spot volatility but caps staking rewards in non-yield ETFs.
Direct ETH buys enable staking, with 36 million ETH locked yielding 3-5% APY. However, they expose holders to gas fees (averaging 5-10 gwei) and bridge risks in DeFi. Metrics favor ETFs for liquidity: average daily volume hits $2 billion, dwarfing DEX trades at $1.5 billion. Yet, on-chain analysis via Arkham reveals whales prefer spot for accumulation, scooping $162 million ETH recently amid ETF hesitation.
| Metric | Spot ETFs | Direct ETH |
|---|---|---|
| On-Chain Activity | Low (AP-driven) | High (user txns) |
| Yield Access | Limited | Staking 4% and |
| Custody Risk | Institutional | Self/Smart Contract |
| Liquidity | High (TradFi) | DEX/Spot |
Whale Tug-of-War: ETF Boost Countered by Spot Sales
Whale outflows of 3.8 million ETH clash with steady ETF inflows over three months, coinciding with futures short interest spikes. Hedge funds and basis traders exploit premiums, shorting futures while buying spot via ETFs. Result: ETH tests $1,940.01 support, with double-bottom patterns hinting at rebound if inflows persist.

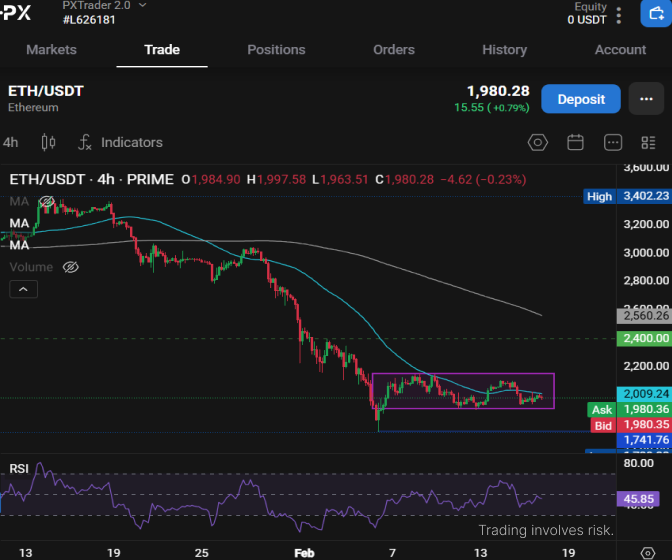
The price of #Ethereum remains below the 50 SMA, and the RSI is below 50, favouring a break to the downside.
📊 Will bears be able to break the key $1,900 level? https://t.co/skIMJlAYRU
On-chain evidence from Etherscan shows 100k addresses accumulating post-ETF launches, but supply stickiness collapsed as whales hesitate. For 2026, on-chain ETF analysis suggests hybrids: ETFs for core exposure, spot for yield. Pectra upgrade will slash fees 50%, tilting scales toward direct holds.
Ethereum (ETH) Price Prediction 2027-2032
Projections for 2026 investors based on spot ETF inflows, surging on-chain activity, and Ethereum network upgrades amid current price of $1,940
| Year | Minimum Price | Average Price | Maximum Price | YoY % Change (Avg) | Key Scenario |
|---|---|---|---|---|---|
| 2027 | $3,500 | $6,000 | $9,000 | +50% | Bullish ETF-driven recovery post-2026 consolidation |
| 2028 | $5,000 | $9,000 | $14,000 | +50% | DeFi boom and Pectra upgrade scalability boost |
| 2029 | $7,000 | $13,000 | $20,000 | +44% | Institutional adoption accelerates amid favorable regulations |
| 2030 | $10,000 | $18,000 | $28,000 | +38% | Global settlement layer dominance vs. L2 competition |
| 2031 | $13,000 | $24,000 | $36,000 | +33% | Yield-generating asset maturity with staking growth |
| 2032 | $16,000 | $32,000 | $48,000 | +33% | Mass adoption cycle peak with ETF and on-chain synergy |
Price Prediction Summary
Ethereum’s price is forecasted to experience substantial growth from 2027-2032, with average prices climbing from $6,000 to $32,000 (8x increase), fueled by record ETF inflows ($1.74B single-day highs), unprecedented on-chain activity (2.3M+ txns/day), BlackRock’s 3M ETH holdings, and upgrades like Pectra/Fusaka. Min/Max ranges account for bearish whale outflows and bullish institutional accumulation.
Key Factors Affecting Ethereum Price
- Spot ETH ETF inflows ($1.74B+ peaks, BlackRock 3M ETH ~$9B)
- On-chain surge: 2.3M+ daily txns, 995k active addresses, 36M ETH staked
- Technological upgrades (Pectra, Fusaka) enhancing scalability/efficiency
- Institutional vs. whale dynamics: ETF buying pressure counters outflows
- DeFi/stablecoin adoption and Ethereum as yield-generating infrastructure
- Market cycles, regulatory clarity, and competition from L2s/solana
Disclaimer: Cryptocurrency price predictions are speculative and based on current market analysis.
Actual prices may vary significantly due to market volatility, regulatory changes, and other factors.
Always do your own research before making investment decisions.
Upgrades like Pectra and Fusaka promise 50% fee reductions and better scalability, potentially boosting direct ETH appeal by minimizing gas costs to under 2 gwei during peaks. Yet, at $1,940.01, spot ETFs maintain an edge in accessibility, drawing $1.74 billion inflows that custodied BlackRock’s 3 million ETH stash. Recent surges past Bitcoin inflows highlight this institutional tilt, even as whales counter with spot sales.
Yield Dynamics: Staking Rewards Tip Scales Toward Spot
Staking defines Ethereum’s yield narrative, with 36 million ETH locked at 4% APY generating $1.2 billion annual rewards. Direct holders capture this fully via protocols like Lido or Rocket Pool, where on-chain metrics show TVL exceeding $30 billion. Spot ETFs lag: most non-staking versions yield zero, though emerging staked ETPs bridge the gap at 2-3% after fees. Fireblocks analysis confirms spot staking suits yield chasers, but ETFs simplify for tax-advantaged accounts.
ETH ETF whale activity reveals divergence: whales accumulated $162 million spot ETH using Arkham-tracked wallets, bypassing ETF premiums. On-chain ETF analysis pinpoints this: ETF holdings reduce circulating supply by 1.2%, but spot buys fuel DeFi liquidity, with DEX volumes at $1.5 billion daily versus ETF’s TradFi depth. At current $1,940.01 levels, hybrid portfolios optimize: 60% ETF for liquidity, 40% spot for yield.
Ethereum Spot ETF vs Direct ETH – Key Metrics
| Metric | Ethereum Spot ETF | Direct ETH Buy |
|---|---|---|
| On-Chain Activity | High boost from $1.74B inflows; BlackRock holds 3M ETH 🚀 | 2.3M+ daily txns, ~995k active addresses, 36M ETH staked 📈 |
| Yield APY | 0% (No native staking) | ~3-5% via staking rewards 💰 |
| Custody Risk | Low (Institutional custodians like Coinbase) 🔒 | Medium-High (Self-custody required) ⚠️ |
| Liquidity Volume | High (TradFi hours, institutional depth) | Very High (24/7 CEX/DEX) 🌊 |
| Whale Preference | Moderate (Institutional inflows) | High ($162M accumulation tracked) 🐳 |
Risks and Regulation: Custody Tradeoffs Exposed by On-Chain Data
Custody risks split the debate. Spot ETH demands self-management or smart contracts, with $300 million lost to hacks in 2025 per Chainalysis. ETFs offload this to BlackRock-grade vaults, but creations/redemptions expose indirect price headwinds, as CryptoSlate notes AP arbitrage decoupled from spot. Regulatory clarity favors ETFs for U. S. investors, yet SEC scrutiny on staking ETFs persists.
On-chain metrics quantify: direct ETH sees 2.9 million transactions daily, amplifying gas volatility; ETFs sidestep this, with flows steady amid 995k active addresses. Whale tug-of-war persists, outflows of 3.8 million ETH pressuring $1,940.01, but ETF buying absorbs 70% of net demand per Glassnode.
Basis traders amplify this: short futures while longing ETFs, pocketing premiums as futures shorts hit record highs. For 2026, ethereum spot etf vs direct eth boils down to profile: institutions lean ETF for compliance, quants favor spot for composability.
2026 Outlook: Metrics Point to Hybrid Dominance
Projecting forward, on-chain ETF analysis forecasts $50 billion ETF AUM if inflows average $500 million weekly, per historical Bitcoin parallels. Combined with Pectra’s efficiency gains, ETH could test $3,500 by mid-year, assuming staking hits 40 million ETH. Direct buys shine in DeFi bull runs, where yields spike to 7% APY.
Monitor eth etf whale activity via Nansen dashboards: sustained inflows above $1 billion monthly signal breakouts above $2,035.08 highs. Crypto ETF on-chain metrics like exchange reserves dropping 15% YTD favor bulls. Ethereum ETF vs holding ETH? Data screams diversification: ETFs mute downside at $1,927.72 lows, spot captures upside alpha.
Investors eyeing 2026 should track these flows religiously. BlackRock’s ETHA trajectory, whale hesitations, and transaction surges past 2.3 million daily paint a network primed for growth. Whether via ETF wrappers or raw spot, Ethereum’s infrastructure bet pays dividends in a yield-first era.