
October 2024 has cemented itself as a watershed moment for institutional Bitcoin adoption, with BlackRock’s spot Bitcoin ETF (IBIT) acting as the linchpin. Amid a climate of macroeconomic uncertainty and surging demand for regulated crypto exposure, IBIT’s daily inflows have not just broken records but fundamentally altered the rhythm of Bitcoin’s market activity. With Bitcoin (BTC) trading at $107,748.00: a level that would have seemed fantastical just a year ago, the interplay between ETF flows and spot market dynamics is now impossible to ignore.
BlackRock’s IBIT: The Institutional Engine Behind Record Inflows
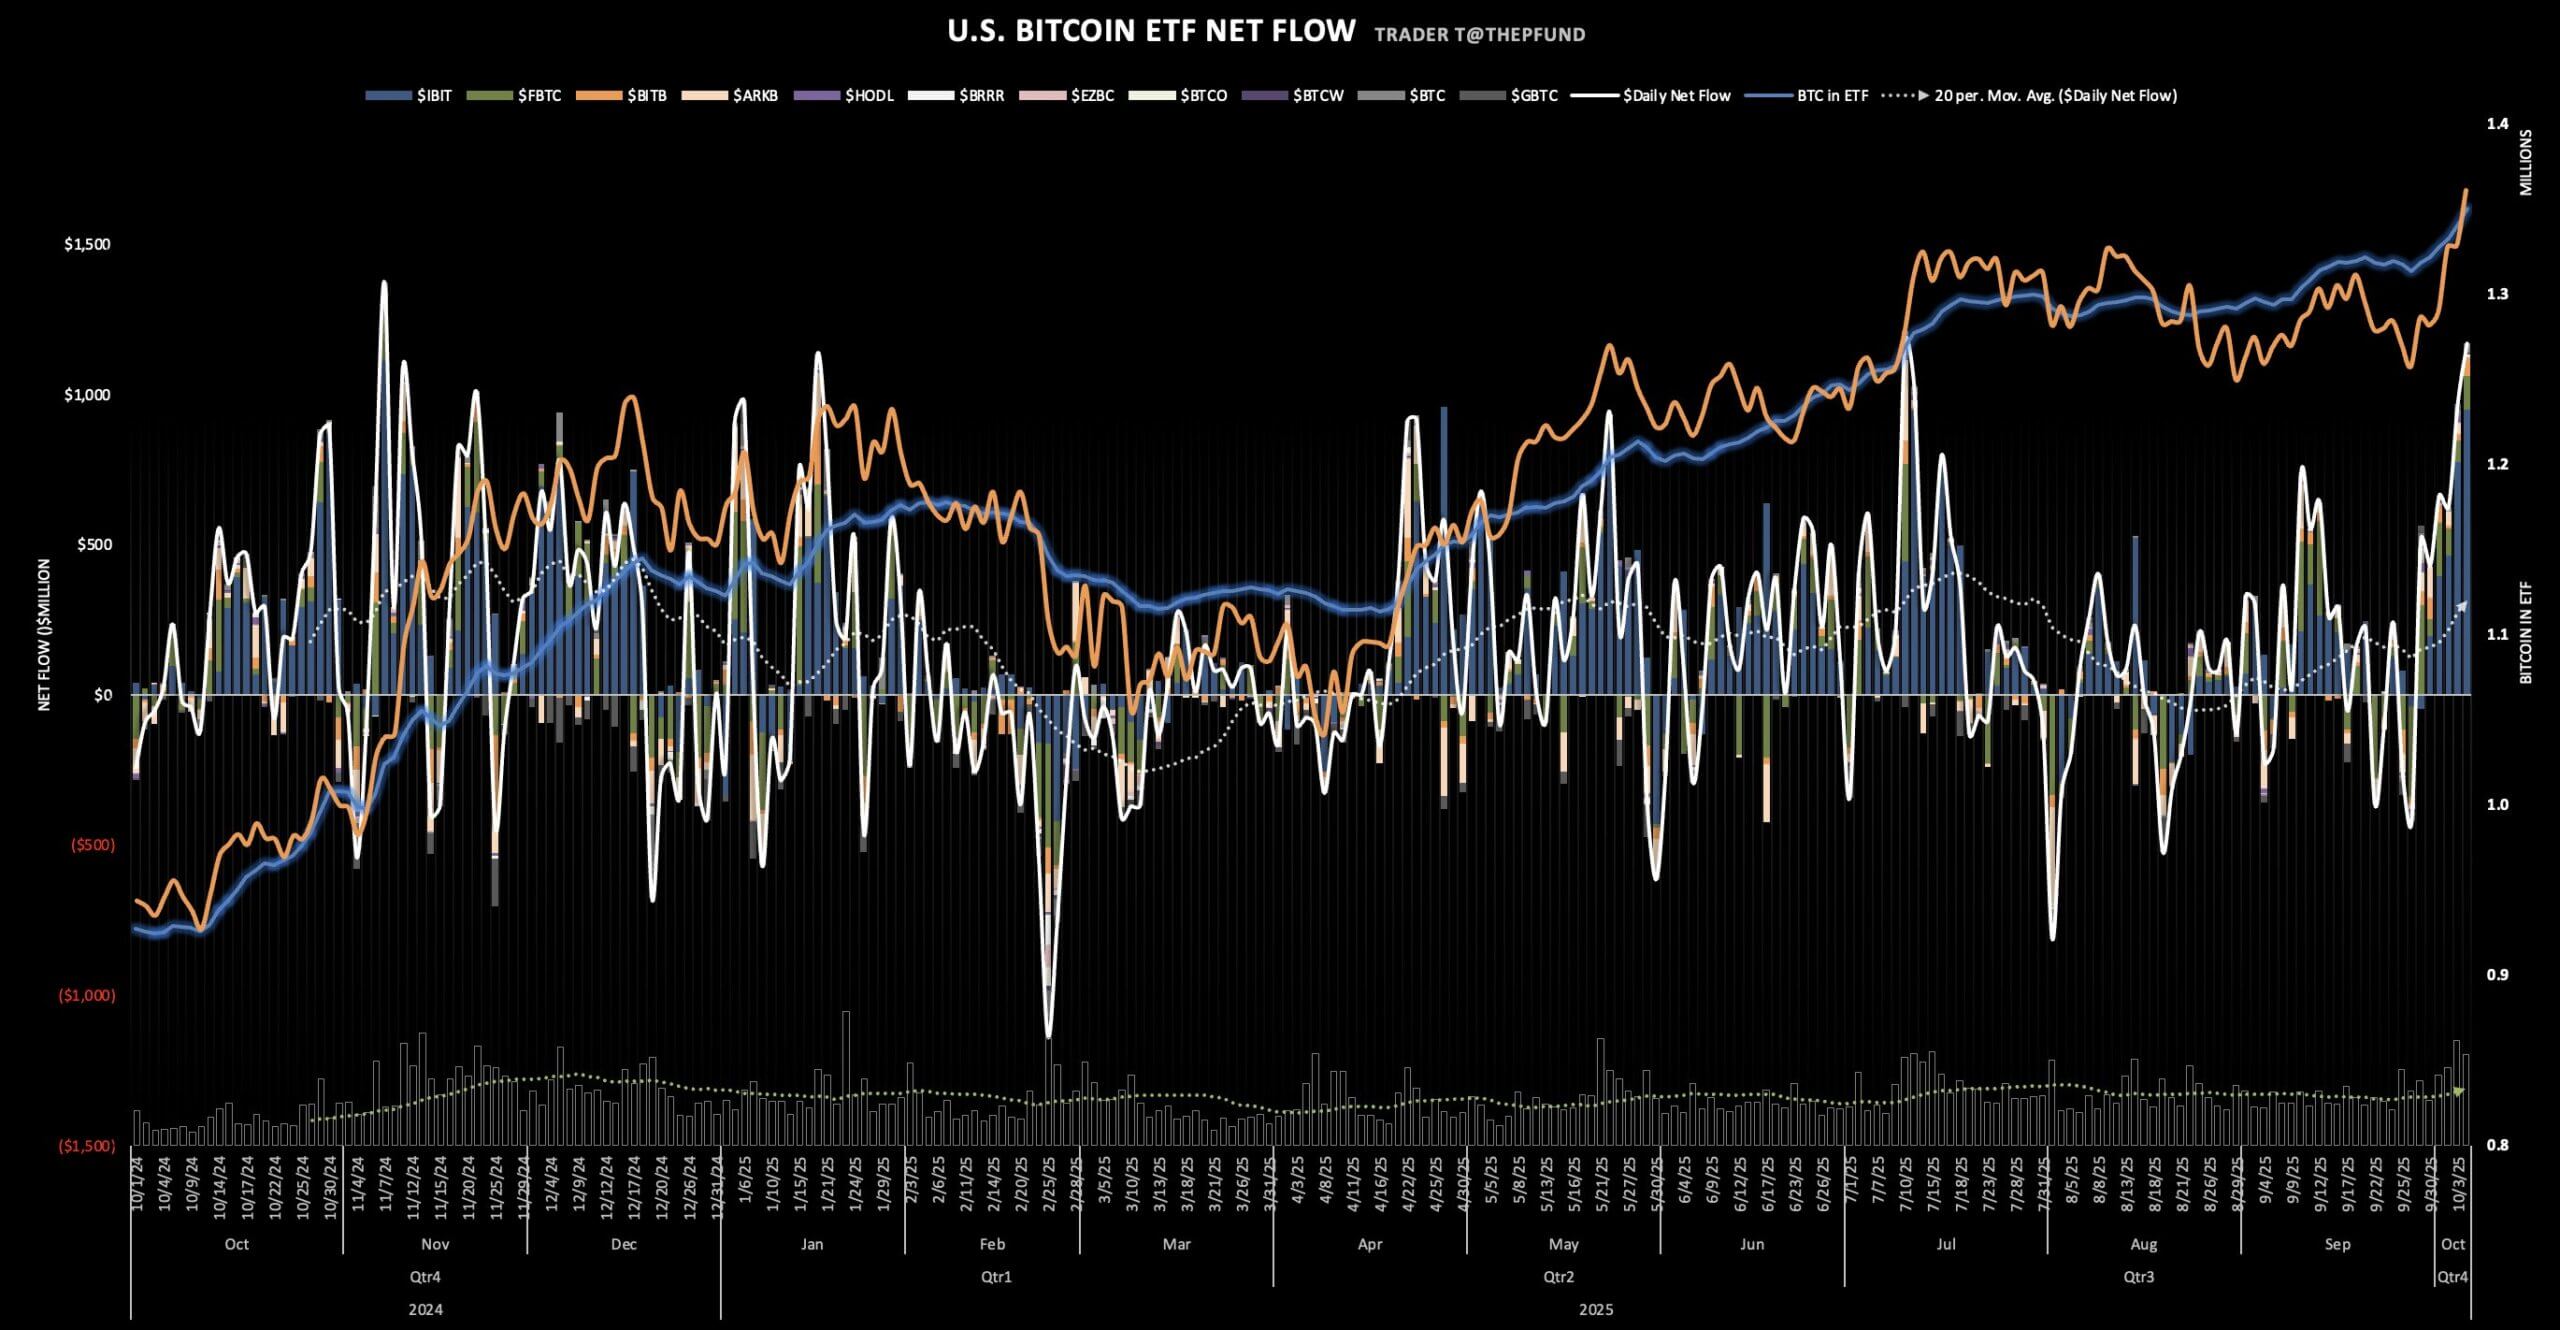
The narrative is clear: BlackRock spot Bitcoin ETF is now the gravitational center of U. S. crypto ETF trends. In October alone, IBIT surpassed 800,000 BTC in assets, drawing in nearly $65 billion in net inflows since launch (theblock. co). Over just 13 consecutive trading days, the fund attracted approximately $4.08 billion, with a single-day record of $875 million on October 30. Such figures are not just statistical curiosities, they are seismic events, reflecting the surging institutional demand for Bitcoin ETFs.
This wave of capital has had a pronounced effect on daily BTC inflows. On October 29, IBIT posted a staggering $3.35 billion in trading volume, its highest in over six months. The cause? A potent brew of FOMO and strategic allocation, as investors scrambled to secure exposure before BTC’s next leg higher.
From ETF Inflows to Spot Price: Tracing the Ripple Effect
The correlation between BlackRock’s ETF inflows and BTC’s price trajectory is no longer theoretical, it’s observable in real time. As IBIT and its peers hoover up supply, exchange-held BTC has reached multi-year lows, tightening liquidity and amplifying price sensitivity to fresh demand. On October 29, Bitcoin hovered at $72,390, just 2% shy of its all-time high, yet the market was already anticipating higher highs as ETF-driven accumulation intensified.
This feedback loop is reshaping the landscape for both retail and institutional participants. The ETF mechanism provides an on-ramp for capital that previously sat on the sidelines due to regulatory or custodial concerns. Now, with the likes of BlackRock offering institutional-grade access, the wall of money entering crypto markets is only growing taller.
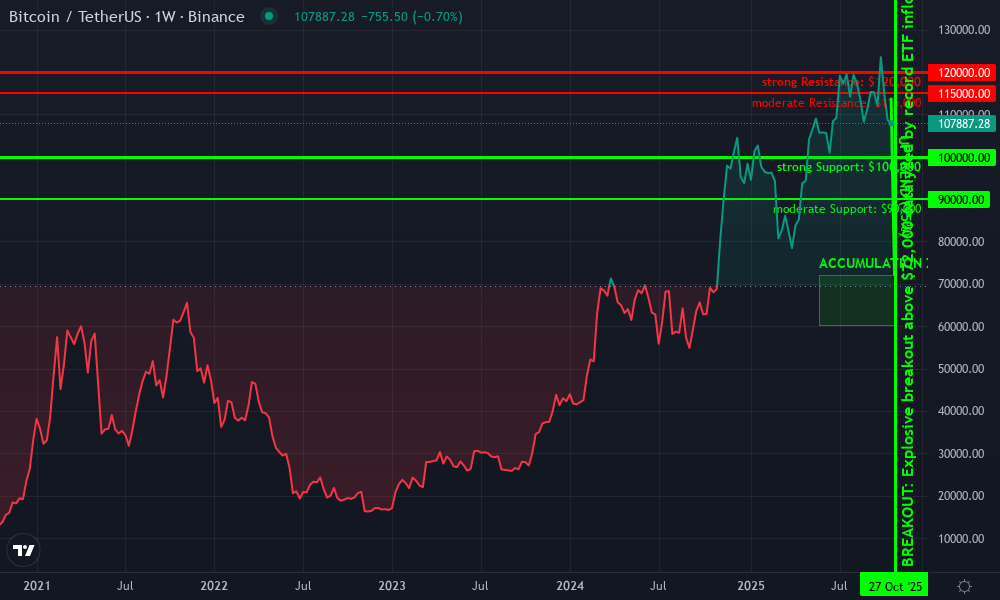
Bitcoin Technical Analysis Chart
Analysis by Owen Gallagher | Symbol: BINANCE:BTCUSDT | Interval: 1W | Drawings: 7
Technical Analysis Summary
Drawing analysis for this BTC chart should focus on highlighting the dramatic transition from consolidation and accumulation below $72,000 to the aggressive uptrend that began in late Q4 2024, coinciding with surging ETF inflows. Use a primary uptrend line from the November 2024 breakout (approx. $72,000) to the current October 2025 high ($113,925), with horizontal lines marking major support at $100,000 and resistance at $120,000. Mark the current price region ($107,748) as a potential short-term consolidation or retest zone. Annotate the ETF inflow surge as a special event catalyzing the breakout. Use rectangles to highlight the accumulation range pre-breakout and the current high-volatility price band ($100,000–$120,000).
Risk Assessment: medium
Analysis: While the uptrend is structurally sound and driven by institutional flows, the market is at or near historic highs with increased volatility. Upside is possible but so is a sharp correction, particularly if ETF inflows slow or macro headwinds emerge.
Owen Gallagher's Recommendation: Remain disciplined—only add exposure on clear retests of strong support ($100,000) and maintain tight stops below $95,000. Avoid chasing price at resistance. For conservative, fundamentals-driven investors, scaling in on dips remains preferable to breakout chasing at these levels.
Key Support & Resistance Levels
📈 Support Levels:
- $100,000 - Round number and recent retest zone; marks psychological support. strong
- $90,000 - Previous local lows, possible secondary support if $100k fails. moderate
📉 Resistance Levels:
- $120,000 - Recent swing high and clear resistance ceiling. strong
- $115,000 - Minor resistance, top of recent price rejection. moderate
Trading Zones (low risk tolerance)
🎯 Entry Zones:
- $100,000 - Potential retest of psychological and technical support after ETF-driven rally; fits low-risk, conservative buy criteria. low risk
🚪 Exit Zones:
- $120,000 - Clear resistance and recent local high; prudent profit-taking zone for conservative traders. 💰 profit target
- $95,000 - Breakdown below here signals a structural failure of the uptrend. 🛡️ stop loss
Technical Indicators Analysis
📊 Volume Analysis:
Pattern: Volume likely surged during the ETF inflow spike and price breakout in late 2024 and Q1 2025; annotate this period for context.
Use callouts or text to highlight the spike in volume coinciding with ETF inflow records.
📈 MACD Analysis:
Signal: Likely bullish crossover during breakout, potential bearish divergence as price nears $120,000.
Annotate bullish momentum from ETF-driven rally, but watch for topping signals as price consolidates.
Disclaimer: This technical analysis by Owen Gallagher is for educational purposes only and should not be considered as financial advice. Trading involves risk, and you should always do your own research before making investment decisions. Past performance does not guarantee future results.The analysis reflects the author's personal methodology and risk tolerance (low).
Liquidity, Volatility, and the New Market Structure
One of the most profound impacts of IBIT’s rise is its influence on market liquidity and volatility. As spot ETFs absorb more BTC from exchanges, available supply shrinks, a dynamic that can both stabilize prices during drawdowns and accelerate rallies during inflow surges. In October 2024, this effect was magnified by record-breaking daily purchases from IBIT and other spot products.
The result? A market that is increasingly driven by ETF flows rather than traditional halving cycles or retail speculation, an evolution explored in our deep dive on Bitcoin ETF flows and market impact. Institutional flows have become the dominant narrative force, dictating not just price but sentiment across the crypto ecosystem.
Bitcoin Price Prediction 2026-2031: Impact of BlackRock’s Spot ETF and Macro Trends
Forecasts based on ETF inflows, institutional adoption, and evolving global crypto market conditions. All prices in USD.
| Year | Minimum Price | Average Price | Maximum Price | Year-over-Year % Change (Avg) | Market Scenario Insights |
|---|---|---|---|---|---|
| 2026 | $85,000 | $120,000 | $170,000 | +11% | ETF inflows support price stability; mild regulatory headwinds may cause volatility |
| 2027 | $97,000 | $137,000 | $195,000 | +14% | Continued mainstream adoption, moderate bull market, expanding global ETF offerings |
| 2028 | $112,000 | $158,000 | $235,000 | +15% | Institutional inflows accelerate, Bitcoin as reserve asset narrative strengthens |
| 2029 | $136,000 | $186,000 | $285,000 | +18% | Potential new all-time highs, global macro tailwinds, increased competition from digital assets |
| 2030 | $158,000 | $215,000 | $330,000 | +16% | Major technology upgrades, regulatory clarity boosts confidence, ETFs dominate inflows |
| 2031 | $176,000 | $242,000 | $370,000 | +13% | Matured mainstream integration, possible saturation, BTC as a core portfolio asset |
Price Prediction Summary
Bitcoin’s price outlook from 2026 to 2031 remains bullish, underpinned by sustained ETF inflows (led by BlackRock’s IBIT), increasing institutional adoption, and expanding regulatory clarity. While volatility and corrections are expected, the long-term trend points to progressive price appreciation with new all-time highs likely before 2030. Minimum and maximum ranges reflect both bullish institutional scenarios and potential bearish macro/regulatory shocks.
Key Factors Affecting Bitcoin Price
- Sustained ETF inflows and mainstream financial integration (especially via BlackRock’s IBIT and other global ETFs)
- Institutional adoption and growing use of Bitcoin as a reserve or portfolio diversification asset
- Regulatory developments in the U.S., Europe, and Asia that could either accelerate or dampen inflows
- Technological improvements (e.g., scalability, security) and integration with broader financial infrastructure
- Macroeconomic trends such as inflation, monetary policy, and global risk appetite
- Potential competition from other cryptocurrencies or digital assets
- Bitcoin halving cycles and supply-side dynamics affecting scarcity and price
Disclaimer: Cryptocurrency price predictions are speculative and based on current market analysis. Actual prices may vary significantly due to market volatility, regulatory changes, and other factors. Always do your own research before making investment decisions.
As we move further into Q4 2024, it’s clear that the crypto ETF inflows analysis must now account for a new paradigm: ETF-driven price discovery. The days of Bitcoin’s price being determined solely by spot exchange activity or cyclical retail manias are fading. Instead, the gravitational pull of BlackRock’s IBIT and its peers is creating a liquidity environment where large institutional reallocations can swing daily flows and, by extension, the entire market’s direction.
Consider the October surge: with IBIT pulling in $524 million in a single day and over $3.24 billion in weekly spot Bitcoin ETF inflows (CoinDCX), the magnitude rivals the aggregate flows of traditional commodity ETFs during periods of macro stress. The significance is not just in the numbers, but in the changing character of market participants. Pension funds, endowments, and sovereign wealth vehicles are now active agents in Bitcoin’s price formation, something unthinkable even at the start of 2024.
![]()
Strategic Implications for Investors: Navigating the ETF Era
For investors, the rise of IBIT and the broader BTC ETF purchases BlackRock has catalyzed is more than a headline; it’s a call to adapt strategies. The ETF’s role as a price anchor means that Bitcoin’s volatility profile is evolving. While short-term swings remain, the presence of steady institutional inflows has the potential to dampen downside shocks and reinforce upward momentum during risk-on cycles.
This is especially relevant for those seeking portfolio diversification. Exposure via spot ETFs offers regulated, liquid, and tax-efficient access, attributes that are increasingly prized in a world where digital assets are no longer fringe, but foundational. For a deeper look at how spot Bitcoin ETFs are changing portfolio construction, see our analysis on how spot Bitcoin ETFs impact crypto portfolio diversification.
Top 5 Drivers of BlackRock’s IBIT Inflows in October 2024
- 1. Record-Breaking Bitcoin Price Action: As Bitcoin surged to $72,390 on October 29, 2024, just 2% below its all-time high, investor enthusiasm soared. This price rally fueled significant inflows into IBIT as both retail and institutional investors sought exposure to BTC’s upside potential.
- 2. Fear of Missing Out (FOMO) Among Investors: The rapid ascent of BTC prices and IBIT’s record daily trading volume of $3.35 billion on October 29, 2024, signaled widespread FOMO. This psychological driver pushed investors to allocate capital to IBIT to avoid missing further gains.

- 3. Institutional Adoption via Regulated Vehicles: BlackRock’s IBIT provided a compliant, regulated avenue for institutional investors to gain Bitcoin exposure. The growing comfort of pension funds, asset managers, and corporations with ETFs drove consistent inflows throughout the month.

- 4. Consecutive Days of Strong Inflows: IBIT recorded 13 straight days of inflows in late October, culminating in a single-day record of $875 million on October 30, 2024. This momentum effect reinforced confidence in the ETF and attracted additional capital.

- 5. Enhanced Market Liquidity and Stability: The surge in IBIT inflows contributed to deeper market liquidity and reduced volatility for Bitcoin. As IBIT amassed over 800,000 BTC in assets, its scale helped stabilize price action and made BTC more attractive to large investors.
Yet, with opportunity comes new risks. The concentration of flows through a handful of mega-ETFs could create feedback loops, where sharp inflow reversals, as seen with the $1.2 billion in net outflows last week (CryptoSlate), can amplify volatility and test market resilience. Investors should monitor not just price, but the pace and persistence of ETF inflows as a leading indicator for sentiment shifts.
Macro Outlook: ETF Flows Shape Bitcoin’s Next Chapter
Looking ahead, the macro backdrop remains pivotal. With Bitcoin trading at $107,748.00: a price that cements its status as a global macro asset, ETF flows are likely to remain the single most important variable. Should risk appetite persist and regulatory clarity continue to improve, the institutional wall of money may only grow taller.
However, the market’s newfound reliance on ETF-driven demand means that any regulatory headwinds or shifts in institutional allocation strategies could introduce fresh volatility. For those tracking the pulse of institutional adoption and its cascading effects, our coverage on how institutional inflows are shaping market momentum in 2025 offers essential context.
How do you think BlackRock’s IBIT ETF will impact Bitcoin’s price in the next 6 months?
BlackRock's iShares Bitcoin Trust (IBIT) saw record inflows and trading volumes in October 2024, helping drive Bitcoin (BTC) to $107,748—near its all-time high. With institutional adoption rising, we're curious about your outlook on IBIT's influence on BTC price movements in the coming months.
Ultimately, October 2024 will be remembered as the month when BlackRock’s spot Bitcoin ETF didn’t just break records, it redefined the structure of the Bitcoin market. As the integration between traditional finance and crypto deepens, ETF flows will remain the lodestar for both price discovery and market psychology. Investors, both institutional and retail, would do well to read between the lines, and watch the flows.


No comments yet. Be the first to share your thoughts!