
The fourth quarter of 2025 is shaping up as a historic inflection point for crypto markets, with ETF inflows fueling dramatic price surges in both Bitcoin and Ethereum. As institutional capital pours into regulated exchange-traded funds, the landscape for digital assets is rapidly evolving, with on-chain ETF analytics revealing significant shifts in investor behavior. The latest market data underscores this transformation: on October 2,2025, Bitcoin (BTC) is trading at $119,966.00 and Ethereum (ETH) at $4,439.52, both reflecting robust gains driven by ETF demand.
ETF Inflows Reach New Highs: Institutional Appetite Surges
In just one day, September 30, U. S. -listed spot Bitcoin and Ethereum ETFs attracted over $1 billion in net inflows. Notably, Ethereum ETFs led the charge with $547 million while Bitcoin ETFs followed closely at $522 million (source). This surge isn’t an isolated event but part of a broader trend that has defined Q4 2025. Institutional investors are now leveraging ETFs to gain compliant exposure to crypto assets, a shift that has fundamentally changed market dynamics.
The drivers behind these flows are multi-faceted. Regulatory clarity has improved, with the SEC’s greenlight for Ethereum spot ETFs earlier this year acting as a catalyst for pent-up demand. Major asset managers such as BlackRock and Fidelity have played pivotal roles: Fidelity’s FBTC led Bitcoin ETF inflows with $315.18 million, while BlackRock’s IBIT followed with $264.71 million (source). For Ethereum, similar institutional confidence is evident as outflows reversed course and net investments surged.
Price Milestones: Bitcoin Holds Firm Near $120,000 as Inflows Accelerate
The impact of these record-breaking ETF inflows on price action is unmistakable. As of October 2, Bitcoin maintains its position just under the psychological $120,000 mark at $119,966.00, up 2.15% over the previous close. This rally coincides directly with heightened ETF activity, a clear signal that institutional flows are no longer a sideshow but a primary driver of price discovery in crypto markets.
This upward momentum isn’t limited to Bitcoin alone. Ethereum’s price has also surged to $4,439.52, reflecting renewed confidence among both institutional and retail participants after months of tepid performance earlier in the year (source). Analysts at Citigroup recently raised their year-end ETH target to $4,500 citing strong ETF inflows and digital asset treasury allocations (source).
Bitcoin Price Prediction 2026-2031: ETF Inflows and Institutional Adoption Outlook
Professional BTC outlook based on Q4 2025 ETF-driven surge and forward-looking market analysis
| Year | Minimum Price | Average Price | Maximum Price | % Change (YoY avg) | Market Scenario Insights |
|---|---|---|---|---|---|
| 2026 | $95,000 | $125,000 | $170,000 | +4.2% | Possible post-ETF surge correction; price stabilizing as ETF inflows remain steady but profit-taking increases volatility. |
| 2027 | $110,000 | $142,000 | $200,000 | +13.6% | Renewed institutional accumulation amid global ETF launches; adoption in emerging markets boosts sentiment. |
| 2028 | $125,000 | $165,000 | $250,000 | +16.2% | Next Bitcoin halving anticipated; supply shock and rising demand from sovereign funds drive prices higher. |
| 2029 | $140,000 | $185,000 | $300,000 | +12.1% | Mainstream adoption accelerates, financial institutions increase crypto allocations; regulatory clarity in major economies. |
| 2030 | $155,000 | $210,000 | $350,000 | +13.5% | Technological advancements (e.g., Layer 2, institutional custody) and increased use in settlement/payment systems. |
| 2031 | $170,000 | $240,000 | $400,000 | +14.3% | Bitcoin matures as a global asset class; possible competition from CBDCs and new crypto innovations, but ETF inflows and digital gold narrative remain strong. |
Price Prediction Summary
Bitcoin's price outlook from 2026 to 2031 remains strong, underpinned by robust ETF inflows, increasing institutional adoption, and periodic supply shocks such as halvings. While short-term corrections are possible after the 2025 surge, the long-term trajectory is upward, with average annual price increases driven by expanding global acceptance and integration into mainstream finance. Minimum and maximum ranges reflect potential volatility, profit-taking, and macroeconomic uncertainties.
Key Factors Affecting Bitcoin Price
- Sustained and growing ETF inflows attracting institutional capital.
- Regulatory developments in the U.S., Europe, and Asia affecting investor confidence.
- Bitcoin supply dynamics, especially post-halving events.
- Adoption trends among corporations, sovereign funds, and retail investors.
- Technological improvements enhancing scalability and security.
- Potential competition from Ethereum, CBDCs, and other digital assets.
- Macroeconomic factors such as inflation, monetary policy, and global risk appetite.
Disclaimer: Cryptocurrency price predictions are speculative and based on current market analysis. Actual prices may vary significantly due to market volatility, regulatory changes, and other factors. Always do your own research before making investment decisions.
Differentiating Flows: Ethereum Outpaces Bitcoin in Q4 Inflows
A critical development this quarter is the shift in relative flows between major crypto assets. While Bitcoin remains the bellwether for institutional adoption, BlackRock’s iShares Bitcoin ETF now holds over 760,000 BTC according to AInvest, Ethereum has gained significant ground among allocators seeking exposure beyond digital gold.
- Ethereum ETFs saw net inflows surpassing those of Bitcoin during several key weeks in Q4.
- This signals not only diversification but also growing conviction in Ethereum’s ecosystem potential.
The competitive dynamic between these two market leaders highlights how ETF products are reshaping portfolio construction strategies across traditional finance. With BlackRock’s ETHA setting single-day records ($266 million), and Fidelity adding over $200 million to its ETH holdings recently (source), it’s clear that capital allocation patterns are evolving rapidly.
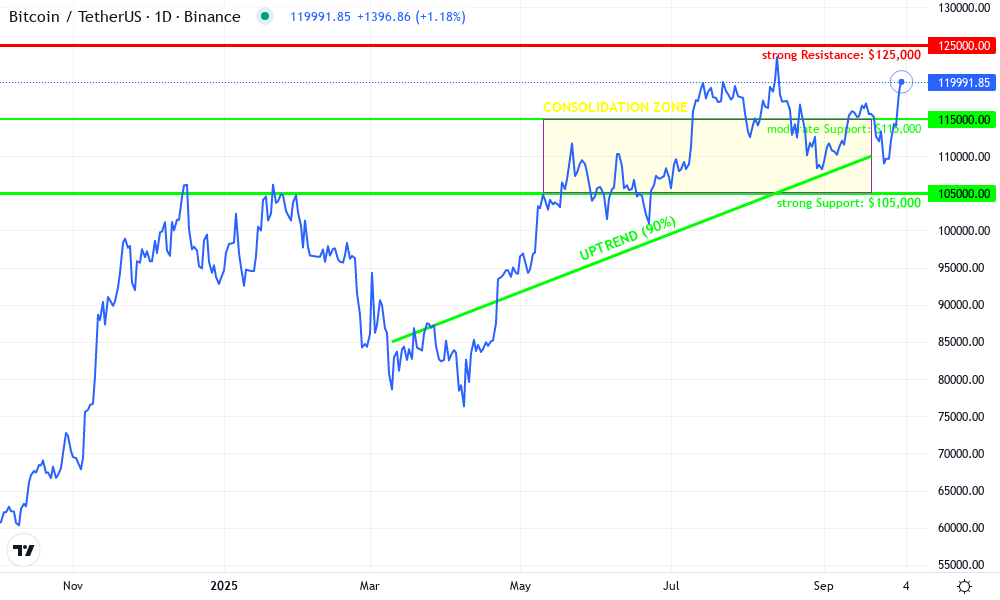
Bitcoin Technical Analysis Chart
Analysis by Evelyn Porter | Symbol: BINANCE:BTCUSDT | Interval: 1D | Drawings: 5
Technical Analysis Summary
Given the significant ETF-driven capital inflows and the price action visible on the daily chart, I would apply a conservative technical approach: Draw horizontal lines at the clear recent swing highs (~$125,000) and swing lows (~$105,000) to define the primary resistance and support zones. Use a trend line to connect the higher lows from March 2025 through the most recent trough in September, confirming the sustained uptrend. Highlight the recent sharp recovery and breakout attempt above $119,500 with a callout, as this is a key short-term signal. Given the strong ETF flows, note the acceleration in price action since late Q3 2025. Mark potential accumulation and consolidation zones between $105,000 and $115,000, where price spent significant time during summer 2025.
Risk Assessment: medium
Analysis: While the structural uptrend is fundamentally supported by strong ETF inflows and institutional adoption, the rapid pace of the rally increases the risk of near-term pullbacks or volatility as positions rebalance. Support levels are well-defined, but any breach below $105,000 would be a warning sign.
Evelyn Porter's Recommendation: For low-risk, long-term investors, add only on clear pullbacks to support, maintain disciplined stop-losses, and avoid chasing extended moves. Continue monitoring institutional flows and macro developments for changes in risk profile.
Key Support & Resistance Levels
📈 Support Levels:
- $105,000 - Major support at the base of the summer consolidation, tested multiple times from May to September 2025. strong
- $115,000 - Recent support from early Q4 2025 breakout, may serve as a near-term floor if price pulls back. moderate
📉 Resistance Levels:
- $125,000 - All-time high and recent swing high in Q3 2025, representing significant resistance. strong
Trading Zones (low risk tolerance)
🎯 Entry Zones:
- $115,000 - Potential entry on pullback to prior breakout zone, aligning with moderate support and institutional demand. low risk
- $105,000 - Strong support and base of previous consolidation; optimal for incremental long-term exposure. low risk
🚪 Exit Zones:
- $125,000 - Previous all-time high and strong resistance; prudent to take partial profits here. 💰 profit target
- $99,000 - Violation of major support would invalidate uptrend; set as a conservative stop-loss. 🛡️ stop loss
Technical Indicators Analysis
📊 Volume Analysis:
Pattern: Not visible in this chart image, but ETF inflow context and price action suggest high volume on breakouts.
Volume likely spiked on ETF-driven breakouts above $115,000 and $119,000. Confirm with volume overlay.
📈 MACD Analysis:
Signal: N/A (MACD not shown in chart image)
MACD confirmation recommended for further validation of trend strength at breakout points.
Applied TradingView Drawing Utilities
This chart analysis utilizes the following professional drawing tools:
Disclaimer: This technical analysis by Evelyn Porter is for educational purposes only and should not be considered as financial advice. Trading involves risk, and you should always do your own research before making investment decisions. Past performance does not guarantee future results. The analysis reflects the author's personal methodology and risk tolerance (low).
Capital is not just flowing into crypto ETFs; it is actively reshaping the structure and sentiment of the entire digital asset market. The sheer volume and velocity of these inflows in Q4 2025 are driving a virtuous cycle: higher ETF demand leads to increased spot buying, which in turn fuels further price appreciation and draws in additional institutional interest. This feedback loop is now a defining characteristic of the ETF era.

On-Chain ETF Analytics: Decoding Investor Behavior
On-chain analytics provide unique insights into how ETF inflows are impacting underlying market liquidity and volatility. Data from leading analytics platforms shows that as ETFs accumulate Bitcoin and Ethereum, exchange reserves for both assets have declined, indicating coins are being moved into long-term custody solutions associated with major fund managers. This reduction in circulating supply amplifies price sensitivity to new inflows, especially during periods of heightened demand.
Moreover, the composition of flows reveals a notable shift away from speculative short-term trading toward longer-term strategic allocations. Institutional buyers, particularly pensions and endowments, are increasingly viewing crypto ETFs as core portfolio holdings rather than tactical trades, a trend that supports price stability even during broader risk-off episodes.
Key Factors Fueling Crypto ETF Inflows in Q4 2025
- Institutional Demand and Capital Allocation: Major asset managers like BlackRock and Fidelity have significantly increased their holdings in Bitcoin and Ethereum ETFs. For example, Fidelity's FBTC led Bitcoin ETF inflows with $315.18 million, while BlackRock's IBIT saw $264.71 million in new investments, underscoring robust institutional appetite.

- Regulatory Clarity and ETF Approvals: The approval of Ethereum spot ETFs in 2025 marked a pivotal moment, triggering record inflows—Ethereum ETFs attracted $547 million in a single day, surpassing Bitcoin ETF inflows. This regulatory progress has boosted investor confidence and legitimized crypto ETFs as mainstream investment vehicles.
- Market Recovery and Price Momentum: The rebound in crypto prices—Bitcoin at $119,966 (up 2.15%) and Ethereum at $4,439.52 (up 2.47%)—has created positive feedback loops. Rising prices attract more inflows, which in turn fuel further price appreciation, reinforcing bullish sentiment.
- Shift in Institutional Portfolio Strategies: Institutional investors are reallocating capital from traditional assets into crypto ETFs, as evidenced by Citigroup raising its year-end price target for Ethereum to $4,500, citing strong ETF and treasury inflows. This shift reflects growing acceptance of digital assets in diversified portfolios.

- Increased Accessibility and Liquidity: The launch and growth of U.S.-listed spot ETFs for both Bitcoin and Ethereum have made it easier for investors to gain exposure to crypto markets through regulated platforms like NYSE Arca and NASDAQ, enhancing overall market liquidity and accessibility.

What’s Next? Implications for Crypto ETF Investors
The sustainability of this rally will depend on whether the current pace of ETF inflows can be maintained or even accelerated. Regulatory developments remain a wildcard, but recent approvals have set a precedent that other jurisdictions may soon follow, potentially opening the door to even larger cross-border capital flows.
For investors tracking crypto ETF trends in 2025, several themes stand out:
- Diversification within digital assets is accelerating: Ethereum’s strong Q4 performance demonstrates growing appetite for multi-asset exposure beyond Bitcoin.
- ETF product innovation continues apace: The emergence of actively managed and on-chain ETFs could further expand access and efficiency for allocators.
- Risk management remains paramount: While inflows support higher prices, volatility persists, investors must balance opportunity with prudent position sizing and portfolio construction.
The integration of regulated ETFs into mainstream portfolios marks a new chapter for digital assets. As we move deeper into Q4 2025, with Bitcoin at $119,966.00 and Ethereum at $4,439.52, both underpinned by record-breaking net inflows, the interplay between institutional demand, regulatory clarity, and innovative fund structures will define the next phase of crypto market evolution.


No comments yet. Be the first to share your thoughts!