In 2024, the arrival of U. S. spot Bitcoin ETFs marked a structural shift in crypto market dynamics, with institutional demand for Bitcoin emerging as a dominant force behind both price discovery and liquidity. As traditional asset managers like BlackRock and Fidelity entered the arena, Bitcoin ETF flows surged to unprecedented levels, reshaping correlations with broader risk assets and reinforcing Bitcoin’s role as a portfolio diversifier.
Record-Breaking Inflows Redefine the Crypto ETF Landscape
By the close of 2024, total inflows into Bitcoin ETFs reached $44.2 billion, representing a staggering 320% increase over the previous cycle’s high-water mark of $10.5 billion in 2021 (source). The catalyst was clear: U. S. regulatory approval for spot Bitcoin ETFs in January 2024 unlocked pent-up institutional capital and offered compliance-conscious investors a secure, liquid vehicle for direct BTC exposure.
BlackRock’s iShares Bitcoin Trust (IBIT) led this wave, attracting more than $37 billion in net inflows, making IBIT the third-largest ETF by inflows across all asset classes in 2024 (source). Fidelity’s Wise Origin Bitcoin Fund (FBTC) also performed strongly with $11.8 billion in inflows, underscoring robust institutional appetite for blue-chip crypto products.
Market Impact: From Speculation to Strategic Allocation
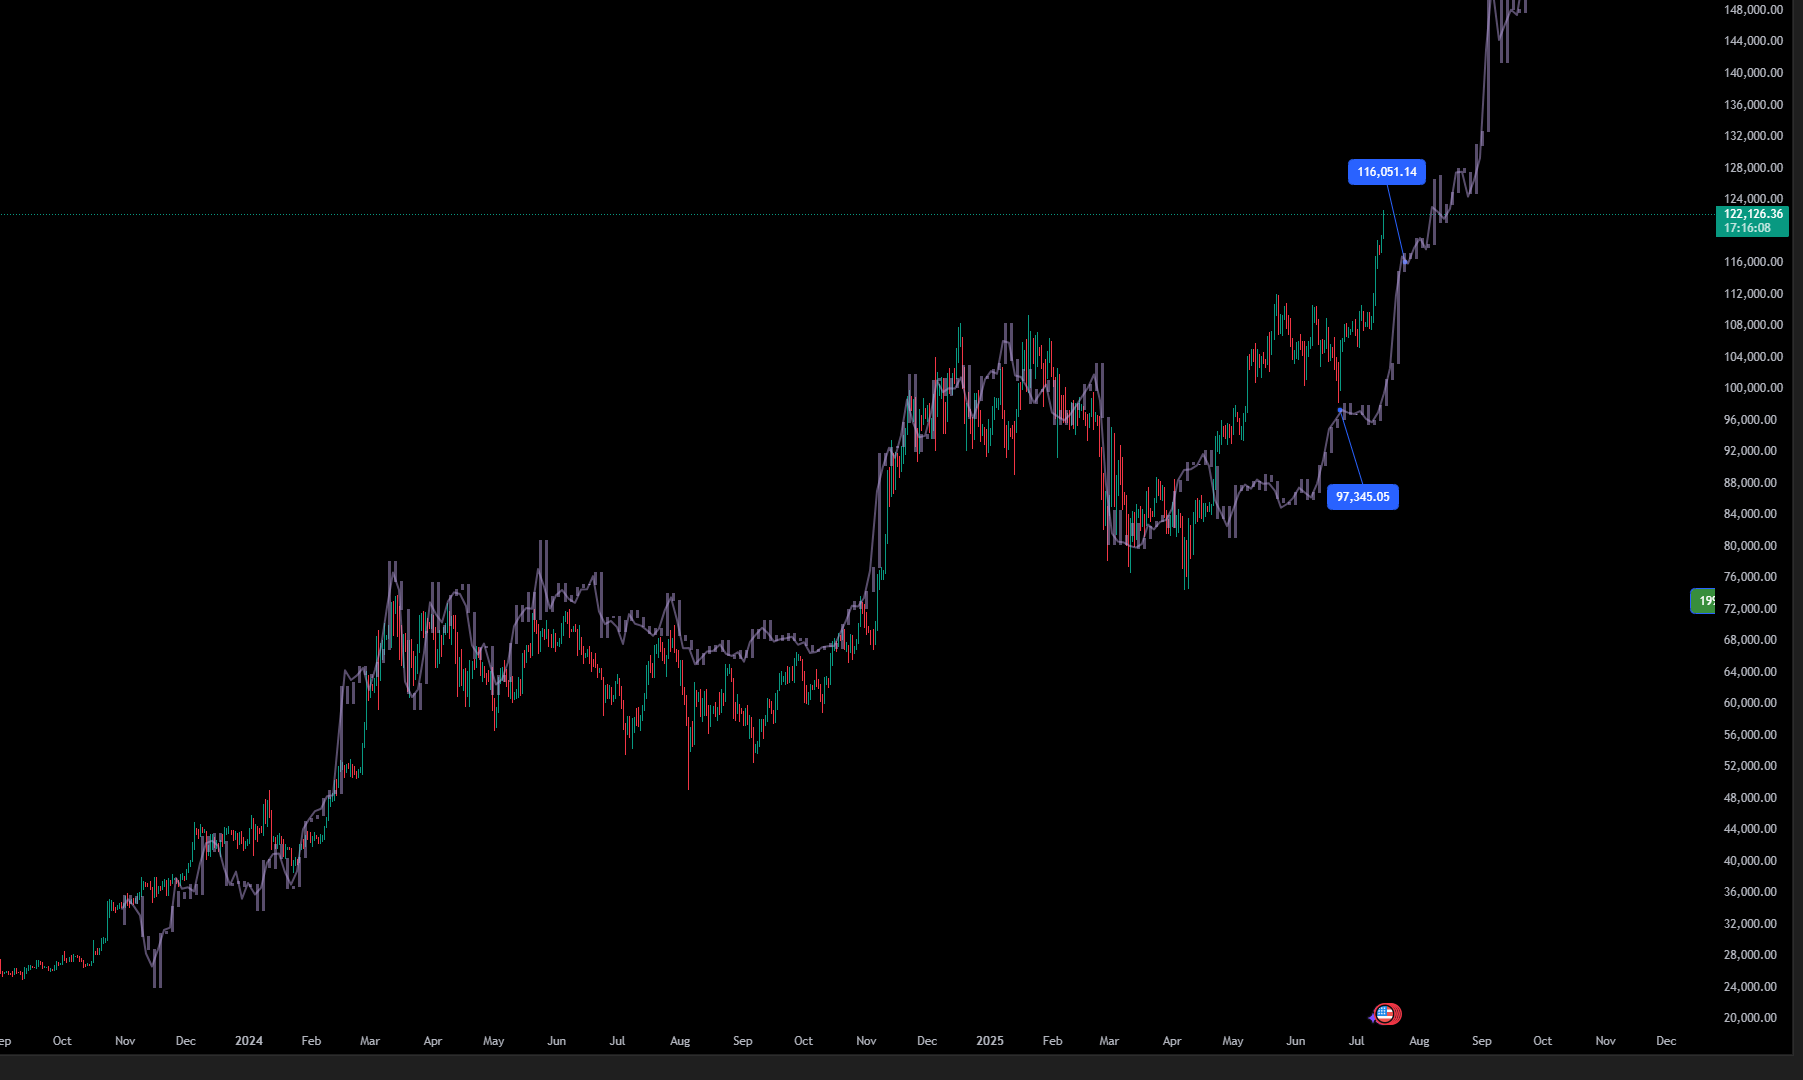
The influx of institutional capital via ETFs had an immediate effect on market structure. As ETF-driven flows intensified, Bitcoin’s price soared past previous highs, peaking above $73,000 in March before stabilizing at its current level of $115,726.00. This rally was not purely speculative, analysts observed that ETF participation linked Bitcoin demand more closely to U. S. monetary policy cycles and macro risk sentiment (source). The result: increased correlation with equities and other risk assets, but also deeper liquidity and reduced volatility during periods of sustained inflow.
Not all ETFs benefited equally from this trend. Grayscale’s GBTC experienced over $21 billion in outflows due to higher fees and competitive pressure from new entrants offering lower-cost structures (source). This rotation highlights how fee compression and product innovation are shaping investor preferences within the crypto ETF sector.
Bitcoin Technical Analysis Chart
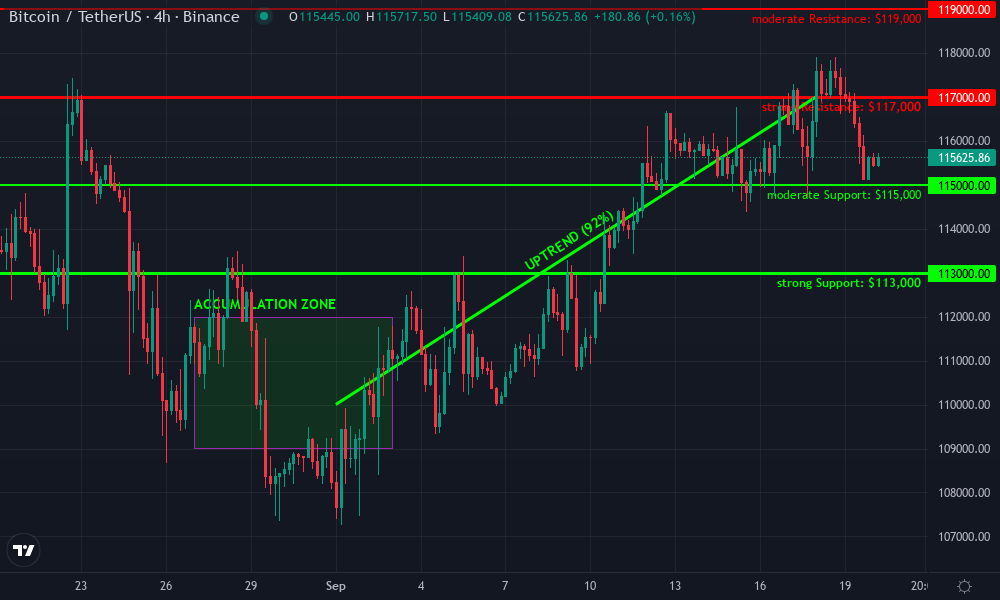
Analysis by Jackson Avery | Symbol: BINANCE:BTCUSDT | Interval: 4h | Drawings: 6
Technical Analysis Summary
Draw an aggressive uptrend line from the early September swing low near $110,000 to the recent high above $117,000. Mark horizontal resistance at $117,000 and support at $115,000 and $113,000. Highlight the current price range ($115,500-$117,000) as a consolidation zone. Use rectangles to indicate the accumulation base (late August to early September) and the current sideways range. Place callouts at breakout attempts above $117,000 and breakdowns near $115,000. Add an arrow marker for potential long entries if support at $115,000 holds, and a short entry below $113,000 if a breakdown occurs. Use text for labeling risk zones and profit targets.
Risk Assessment: high
Analysis: Volatility is coiling after a strong uptrend. Upside potential is high if $117,000 breaks, but downside risk rises rapidly on a loss of $113,000 support. Institutional flows can create sudden moves.
Jackson Avery's Recommendation: Aggressive traders should prepare for breakout entries above $117,000 or catch mean-reversion longs near $115,000 with tight stops. Be nimble—if $113,000 fails, flip bias to short until $111,000. Use volatility to your advantage and let the price action dictate your exposure.
Key Support & Resistance Levels
📈 Support Levels:
- $115,000 - Short-term support, recent consolidation and buying interest. moderate
- $113,000 - Key swing low, must hold for uptrend structure. strong
📉 Resistance Levels:
- $117,000 - Major resistance, recent double top and local high. strong
- $119,000 - Projected next resistance if breakout above $117,000 occurs. moderate
Trading Zones (high risk tolerance)
🎯 Entry Zones:
- $115,000 - Potential long entry on support retest; volatility coil setup. medium risk
- $117,100 - Aggressive long entry on confirmed breakout above resistance. high risk
- $112,900 - Short entry on breakdown of strong support. high risk
🚪 Exit Zones:
- $119,000 - Profit target on breakout swing. 💰 profit target
- $113,000 - Stop loss for longs if breakdown occurs. 🛡️ stop loss
- $111,000 - Profit target for shorts if major support fails. 💰 profit target
Technical Indicators Analysis
📊 Volume Analysis:
Pattern: Volume would confirm move if it spikes on breakout/breakdown.
Watch for volume expansion at $117,000 or $113,000 levels as confirmation.
📈 MACD Analysis:
Signal: Awaiting trigger; likely flat or slightly bullish until breakout direction is confirmed.
MACD should be watched for crossover confirmation on breakout/breakdown.
Applied TradingView Drawing Utilities
This chart analysis utilizes the following professional drawing tools:
Disclaimer: This technical analysis by Jackson Avery is for educational purposes only and should not be considered as financial advice. Trading involves risk, and you should always do your own research before making investment decisions. Past performance does not guarantee future results. The analysis reflects the author's personal methodology and risk tolerance (high).
Institutional Demand as a Price Catalyst
The scale of institutional flows has fundamentally altered supply-demand dynamics for Bitcoin. In Q3 2025 alone, institutions drove $2.34 billion in net ETF inflows while retail traders offloaded over 54,500 BTC amid lingering macro uncertainty (AInvest). This divergence signals that large players are increasingly using ETFs not just for speculation but as long-term strategic allocations, an important evolution from prior market cycles dominated by retail-driven momentum trades.
The cumulative effect is visible on-chain: exchange balances have dropped while ETF custodians accumulate coins at record pace, a pattern consistent with supply absorption by buy-and-hold entities rather than short-term speculators.
Bitcoin Price Prediction 2026-2031: ETF-Driven Institutional Adoption Outlook
Projections based on ongoing ETF flows, institutional demand, and evolving market dynamics post-2024 ETF boom
| Year | Minimum Price | Average Price | Maximum Price | Year-over-Year % Change (Avg) | Market Scenario Insights |
|---|---|---|---|---|---|
| 2026 | $98,000 | $126,000 | $155,000 | +9% | Potential for consolidation as ETF inflows stabilize; regulatory clarity increases but macro headwinds may limit upside. |
| 2027 | $115,000 | $142,000 | $180,000 | +13% | Renewed ETF inflows and possible Fed rate cuts drive demand; increased global ETF adoption and corporate treasury allocations. |
| 2028 | $130,000 | $165,000 | $210,000 | +16% | New technological upgrades (e.g., scalability, privacy) and further regulatory acceptance; possible Bitcoin ETF launches in Asia. |
| 2029 | $145,000 | $188,000 | $250,000 | +14% | Mature ETF market, Bitcoin seen as portfolio staple; competition from other digital assets intensifies but BTC remains dominant. |
| 2030 | $160,000 | $215,000 | $285,000 | +14% | Next Bitcoin halving event, increasing scarcity narrative; potential for sovereign adoption or new institutional products. |
| 2031 | $175,000 | $238,000 | $320,000 | +11% | Sustained institutional flows, Bitcoin as 'digital gold'; regulatory harmonization in major economies supports further growth. |
Price Prediction Summary
Bitcoin's price outlook through 2031 remains robust, underpinned by sustained institutional demand via ETFs, continued global adoption, and evolving regulatory frameworks. While volatility and cyclical corrections are expected, the average price trend remains upward, with potential for both significant upside and downside depending on macroeconomic and market-specific developments.
Key Factors Affecting Bitcoin Price
- ETF inflows and institutional participation: Ongoing growth in ETF assets under management will be a primary driver of demand and price appreciation.
- US and global monetary policy: Correlation to risk assets means Fed policy, inflation, and economic cycles will impact BTC price.
- Regulatory clarity: Positive or negative shifts in US, EU, and Asian regulation can significantly affect institutional participation.
- Technological improvements: Upgrades to Bitcoin's scalability, privacy, and interoperability may enhance its utility and investment appeal.
- Market competition: Emergence of alternative crypto assets and tokenized products may influence Bitcoin's dominance and capital flows.
- Market cycles and halving events: Traditional four-year cycles and supply shocks from halvings will continue to impact price trajectories.
Disclaimer: Cryptocurrency price predictions are speculative and based on current market analysis. Actual prices may vary significantly due to market volatility, regulatory changes, and other factors. Always do your own research before making investment decisions.
ETF-driven demand has also reinforced Bitcoin’s sensitivity to macroeconomic variables. As the Federal Reserve shifted toward rate cuts in 2025, institutional inflows surged, helping propel Bitcoin’s price to its current level of $115,726.00. This responsiveness highlights how crypto ETF flows now act as a transmission mechanism between traditional financial policy and digital asset valuations. In effect, Bitcoin’s market narrative is increasingly intertwined with global liquidity cycles and risk-on sentiment observed in equities and bonds.

ETF Flows Reshape Portfolio Construction
The mainstreaming of crypto ETF market impact is evident in portfolio allocation strategies across pension funds, endowments, and large family offices. With cumulative ETF flows projected to reach $55 billion by year-end 2025 (source), Bitcoin has moved from a fringe speculative asset to a core portfolio holding for institutions seeking asymmetric upside and diversification against fiat debasement risks.
Key Drivers of 2024-2025 Bitcoin ETF Inflows
- Launch of U.S. Spot Bitcoin ETFs: The introduction of spot Bitcoin ETFs in January 2024 catalyzed institutional inflows, offering regulated and accessible exposure to Bitcoin for traditional investors.

- Dominance of BlackRock's IBIT and Fidelity's FBTC: BlackRock's iShares Bitcoin Trust (IBIT) led with over $37 billion in inflows, while Fidelity's Wise Origin Bitcoin Fund (FBTC) attracted $11.8 billion, establishing these funds as primary vehicles for institutional adoption.

- Correlation with U.S. Monetary Policy: ETF-driven flows have linked Bitcoin demand more closely to U.S. monetary policy and market cycles, reinforcing its correlation with other risk assets and influencing institutional allocation strategies.

- Cost-Effective and Secure Access: ETFs like IBIT provide secure, cost-effective Bitcoin exposure, reducing operational complexities and custody risks for institutions compared to direct crypto ownership.

- Record-Breaking Inflows and Price Impact: Over $44.2 billion in 2024 ETF inflows contributed to Bitcoin's price surge, reaching an all-time high above $73,000 in March 2024 and $115,726 as of September 2025, further validating institutional interest.
- Competitive Fee Structures: Lower management fees from new entrants like BlackRock and Fidelity attracted inflows, while higher-fee products such as Grayscale's GBTC saw over $21 billion in outflows.
- Global ETF Expansion: International adoption, including the debut of Poland's first Bitcoin ETF, has broadened the investor base and supported cumulative inflows projected to reach $55 billion in 2025.

However, this shift is not without challenges. The momentum of 2024 Bitcoin ETF inflows slowed in Q2 as short-term profit-taking increased volatility and some investors reassessed risk amid persistent macro uncertainty (Amberdata Blog). Yet data shows that net inflows rebounded as the year progressed, driven by renewed confidence following dovish central bank signals and strong quarterly earnings from leading crypto-native firms.
What Investors Should Watch Next
The future trajectory of Bitcoin ETF flows will depend on several factors: upcoming regulatory decisions on options-based ETFs, continued fee competition among providers, and the evolution of BTC custody solutions for institutional allocators. Sustained net inflows remain the clearest indicator that institutional demand is robust, a trend closely watched by both bulls and bears (Ecoinometrics). Meanwhile, the entrance of new geographic markets such as Poland signals ongoing global expansion for spot Bitcoin ETFs (tradingnews. com).
The bottom line: The data confirms that regulated ETFs have cemented Bitcoin’s role in institutional portfolios, driving deep liquidity, price appreciation, and tighter integration with global financial cycles. As the asset class matures further through 2025 and beyond, investors should expect continued innovation in product design alongside rising competition for assets under management.


No comments yet. Be the first to share your thoughts!