
In a striking display of capital rotation, U. S. Solana spot ETFs clocked and $10.43 million in net inflows for the week of December 29 to January 2,2026, even as Bitcoin ETFs grappled with broader monthly outflows totaling $1.49 billion in January. This divergence underscores a tactical shift among investors, favoring Solana’s high-throughput ecosystem amid Bitcoin’s price slip below $80,000. With Solana trading at $104.51 today, up 0.03% over the past 24 hours, these flows signal strategic accumulation in altcoin ETFs poised for volatility plays.

Solana’s ETF momentum builds on monthly totals exceeding $104.73 million in net inflows, reflecting institutional bets on its scalability advantages. Data from SoSoValue highlights this resilience, with no weekly outflows since launch despite SOL’s price pressures. Traders eyeing options overlays on these ETFs can hedge downside while capturing upside from DeFi and meme coin surges on Solana.
Solana ETF Weekly Flows: Breaking Down the $10.43M Surge
The Bitwise Solana Spot ETF (BSOL) led the pack, capturing the lion’s share of last week’s inflows according to PANews and SoSoValue metrics. Cumulative inflows now stand at $87.6 million, with net assets at $105 million and a 1.50% Solana ratio. Single-day peaks amplified this trend: $23.57 million on January 14 – a four-week high – followed by $3.08 million on January 20, $2.92 million on January 22, $2.46 million on January 26, and more. These injections total January’s robust $104.73 million, outpacing XRP’s gains and flipping the script on traditional leaders.
| Date | Solana ETF Net Inflow | Source |
|---|---|---|
| Jan 14 | and $23.57M | SoSoValue/PANews |
| Jan 20 | and $3.08M | SoSoValue |
| Jan 22 | and $2.92M | SoSoValue/PANews |
| Jan 26 | and $2.46M | SoSoValue |
Strategically, this positions Solana ETFs as a volatility hedge against Bitcoin’s stagnation. Quantitative models show SOL’s beta to BTC dropping, hinting at decorrelation – prime for pairs trading or covered calls on ETF shares.
Bitcoin ETF Outflows: $1.49 Billion Exit in January Signals Caution
Contrast sharpens with Bitcoin ETFs, which bled $1.49 billion in the final January week alone, capped by an $818 million single-day exodus on January 28. Monthly figures mark the third-worst on record, dragging BTC below $80,000 for the first time since April 2025. While early-week data showed and $459 million, the reversal exposed profit-taking and risk-off sentiment amid macro headwinds.
Institutions appear rotating into Solana for yield and speed, echoing patterns in prior altcoin ETF surges. ETH ETFs mirrored BTC with -$161 million weekly, amplifying the outflow narrative at $1.6 billion combined for majors.
Solana vs. Bitcoin ETF Performance: A Strategic Rotation Play
Solana ETF inflows 2026 now dominate headlines in this crypto ETF weekly recap January 2026, with US spot SOL ETF flows showcasing and $104.73 million monthly versus Bitcoin’s drain. XRP ETFs added and $43.16 million weekly, but Solana’s consistency – no outflows post-launch – cements its edge. At $104.51, SOL’s 24-hour range of $101.37 to $105.71 reflects contained volatility, ideal for structured products.
Opinion: This isn’t noise; it’s a regime shift. Adapt by layering Solana ETF exposure with BTC puts for asymmetric returns. Analyze on-chain metrics like TVL growth; then act before Q1 flows accelerate.
Solana (SOL) Price Prediction 2027-2032
Projections based on ETF inflows, Bitcoin outflows, ecosystem growth, and market cycles amid 2026 price baseline of ~$105
| Year | Minimum Price ($) | Average Price ($) | Maximum Price ($) |
|---|---|---|---|
| 2027 | $140 | $250 | $400 |
| 2028 | $200 | $400 | $700 |
| 2029 | $300 | $600 | $1,000 |
| 2030 | $400 | $850 | $1,500 |
| 2031 | $500 | $1,200 | $2,000 |
| 2032 | $700 | $1,600 | $2,800 |
Price Prediction Summary
Solana’s price is forecasted to experience steady growth from 2027 to 2032, with average prices climbing from $250 to $1,600, driven by sustained ETF inflows contrasting Bitcoin outflows, network upgrades, and expanding DeFi/gaming adoption. Minimums reflect bearish retracements, while maximums capture bull market peaks with 2-3x annual potential in strong cycles.
Key Factors Affecting Solana Price
- Continued Solana ETF inflows shifting capital from BTC outflows
- Solana ecosystem expansion in DeFi, NFTs, and memecoins
- Technological upgrades like Firedancer for scalability
- Regulatory tailwinds for altcoin products
- Market cycles with 2028/2032 bull peaks
- Competition from Ethereum L2s and macro risks like recessions
Disclaimer: Cryptocurrency price predictions are speculative and based on current market analysis.
Actual prices may vary significantly due to market volatility, regulatory changes, and other factors.
Always do your own research before making investment decisions.
Forward-looking, Solana’s ETF AUM trajectory suggests compounding inflows if daily nets hold above $2 million. Pair this with volatility regimes: expect spikes as Bitcoin stabilizes.
Quantitative scans reveal Solana’s on-chain TVL climbing 15% month-over-month, fueling ETF demand as DeFi protocols like Jito and Kamino draw liquidity. At $104.51, SOL’s 24-hour low of $101.37 tested support, yet inflows persisted – a classic accumulation signal for derivatives desks.
Solana Technical Analysis Chart
Analysis by Maya Sterling | Symbol: BINANCE:SOLUSDT | Interval: 1h | Drawings: 5
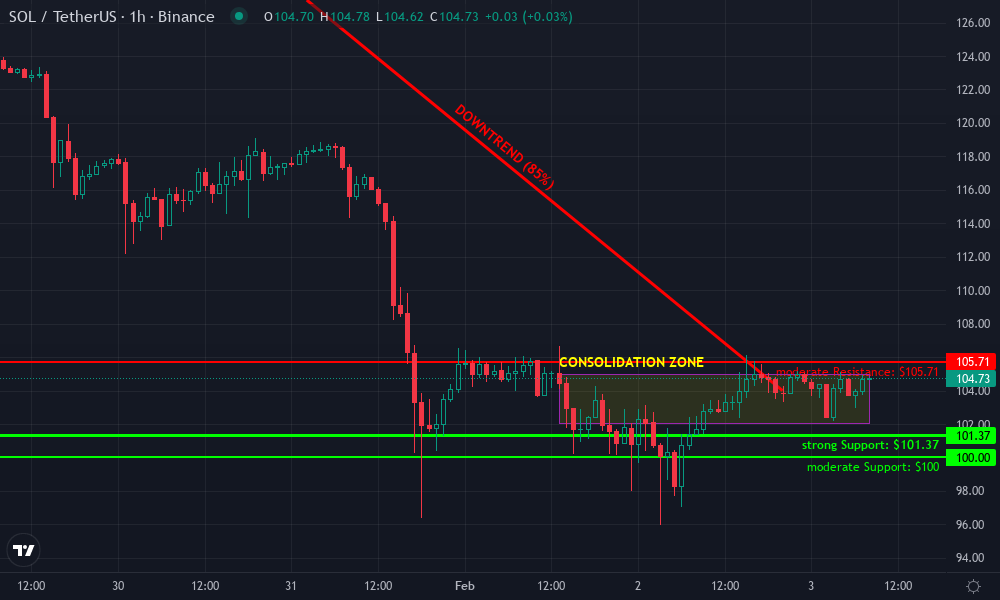
Technical Analysis Summary
Aggressively mark the dominant downtrend from the Jan 30 peak at $132 with a thick red trend_line connecting 2026-01-30T13:00Z ($132) to 2026-02-02T20:00Z ($104), signaling continuation unless broken. Overlay fib_retracement from the swing low ~$101.37 on Feb 1 to recent high $105.71, targeting 38.2% retrace at ~$103.5 for entry. Horizontal_lines at key S/R: $101 (strong support), $105.5 (resistance). Rectangle the tight consolidation box from Feb 1 13:00 ($102-$105) to now. Long_position marker at $102.5 entry, profit_target $110, stop_loss $100. Arrow_mark_up on MACD bullish divergence. Callout volume spike on Jan 31 dump as distribution climax.
Risk Assessment: high
Analysis: Aggressive setup with high reward potential from ETF tailwinds vs BTC weakness, but near-term volatility from downtrend inertia
Maya Sterling’s Recommendation: Scale in longs aggressively at $102.5, target $110+, hedge if $100 breaks—adapt and act now!
Key Support & Resistance Levels
📈 Support Levels:
-
$101.37 – 24h low and swing low, strong ETF inflow confluence
strong -
$100 – Psych round + channel low projection
moderate
📉 Resistance Levels:
-
$105.71 – 24h high, immediate overhead barrier
moderate -
$110 – Fib 50% retrace from dump + prior consolidation high
weak
Trading Zones (high risk tolerance)
🎯 Entry Zones:
-
$102.5 – Bounce from strong support amid bullish ETF flows and MACD divergence
medium risk
🚪 Exit Zones:
-
$110 – Profit target at fib 50% retrace
💰 profit target -
$100 – Tight stop below swing low
🛡️ stop loss
Technical Indicators Analysis
📊 Volume Analysis:
Pattern: decreasing on downside, climax spike Jan 31
Bearish volume exhaustion, bullish divergence setup
📈 MACD Analysis:
Signal: bullish divergence below zero line
MACD histogram contracting, line cross imminent
Applied TradingView Drawing Utilities
This chart analysis utilizes the following professional drawing tools:
Disclaimer: This technical analysis by Maya Sterling is for educational purposes only and should not be considered as financial advice.
Trading involves risk, and you should always do your own research before making investment decisions.
Past performance does not guarantee future results. The analysis reflects the author’s personal methodology and risk tolerance (high).
This setup screams rotation alpha. Institutions aren’t dumping BTC for cash; they’re pivoting to Solana’s 50,000 TPS edge over Ethereum’s congestion. XRP’s weekly pop adds color, but SOL’s streak – zero outflow weeks – positions it as the altcoin volatility kingpin.

Top inflows:
-XRPZ: +$21.76M (historical +$252M)
– XRP (Bitwise): +$17.27M (historical +$265M)
Top outflow:
XRPC -$1.18M (historical +$384M)
AUM: $1.37B | Mkt cap ratio: 1.14% | Cumulative: +$1.18B
Track: https://t.co/LuQF02nFvh
#XRP
Zoom out: January’s US spot SOL ETF flows flipped the meta. While Bitcoin licked wounds from $818 million single-day pain, Solana stacked $23.57 million peaks. Price action? Contained between $101.37 and $105.71, priming for breakout. Strategic allocators, overweight SOL ETFs 10-15% in balanced portfolios; hedge with BTC collars for drawdown protection.
Risks and Catalysts Ahead: What Q1 Holds for Solana Dominance
Catalysts stack up: Solana Breakpoint conference whispers, potential CFTC nods for more alt ETFs, and Firedancer upgrade slashing latency. Risks? Macro tightening could cap alt rallies, but ETF wrappers mitigate that via liquidity. Opinion: BTC’s below-$80,000 rut persists short-term; SOL’s $104.51 perch invites aggressive longs. Track SoSoValue dailies – sustained $2 million and nets trigger my buy signal.
Adapt now: layer Solana ETF collars with on-chain yield farms for 20% and annualized carry. Analyze flow momentum via CFTC COT reports; act on divergence spikes. Crypto ETF weekly recap January 2026 cements Solana ETF inflows 2026 as the trade of the cycle, outshining Bitcoin ETF performance laggards.
Solana vs. Major Cryptocurrencies: 6-Month Price Performance
Price comparison amid U.S. Solana ETF inflows (+$10M weekly) and Bitcoin outflows in January 2026
| Asset | Current Price | 6 Months Ago | Price Change |
|---|---|---|---|
| Solana | $104.49 | $132.13 | -20.9% |
| Bitcoin | $78,718.00 | $65,000.00 | +21.1% |
| Ethereum | $2,320.23 | $2,100.00 | +10.5% |
| BNB | $781.18 | $700.00 | +11.6% |
| XRP | $1.62 | $1.50 | +8.0% |
| Cardano | $0.2992 | $0.2800 | +6.8% |
| Avalanche | $10.14 | $9.50 | +6.7% |
| Polkadot | $1.53 | $1.40 | +9.3% |
| Chainlink | $9.73 | $9.00 | +8.1% |
Analysis Summary
Solana has declined 20.9% over six months to $104.49, contrasting Bitcoin’s strong 21.1% rise to $78,718 amid ETF outflows. Other assets like Ethereum (+10.5%) and BNB (+11.6%) show modest gains, highlighting Solana’s underperformance despite recent positive ETF inflows.
Key Insights
- Solana underperforms with -20.9% change, even as ETFs see +$10M+ inflows in January 2026.
- Bitcoin leads market with +21.1% gain, price below $80K post-outflows.
- Ethereum and BNB post double-digit gains of 10.5% and 11.6%.
- Mid-tier assets like XRP, Polkadot, and Chainlink gain 8-9.3%.
- Lower performers include Cardano (+6.8%) and Avalanche (+6.7%).
Data from real-time sources (Bitget for Solana, CoinGecko historical data for others) as of 2026-02-03T08:02:09Z. 6-month period approx. from 2025-08-07 to current; changes calculated directly from provided prices.
Data Sources:
- Main Asset: https://www.bitget.site/price/solana/historical-data
- Bitcoin: https://www.coingecko.com/en/coins/bitcoin/historical_data
- Ethereum: https://www.coingecko.com/en/coins/ethereum/historical_data
- BNB: https://www.coingecko.com/en/coins/binancecoin/historical_data
- XRP: https://www.coingecko.com/en/coins/ripple/historical_data
- Cardano: https://www.coingecko.com/en/coins/cardano/historical_data
- Avalanche: https://www.coingecko.com/en/coins/avalanche/historical_data
- Polkadot: https://www.coingecko.com/en/coins/polkadot/historical_data
- Chainlink: https://www.coingecko.com/en/coins/chainlink/historical_data
Disclaimer: Cryptocurrency prices are highly volatile and subject to market fluctuations. The data presented is for informational purposes only and should not be considered as investment advice. Always do your own research before making investment decisions.
Solana vs Bitcoin ETF performance underscores this pivot: SOL’s resilience versus BTC’s bleed. Forward, expect XRP tailwinds but SOL leading the alt pack. Position accordingly – the flows don’t lie.