
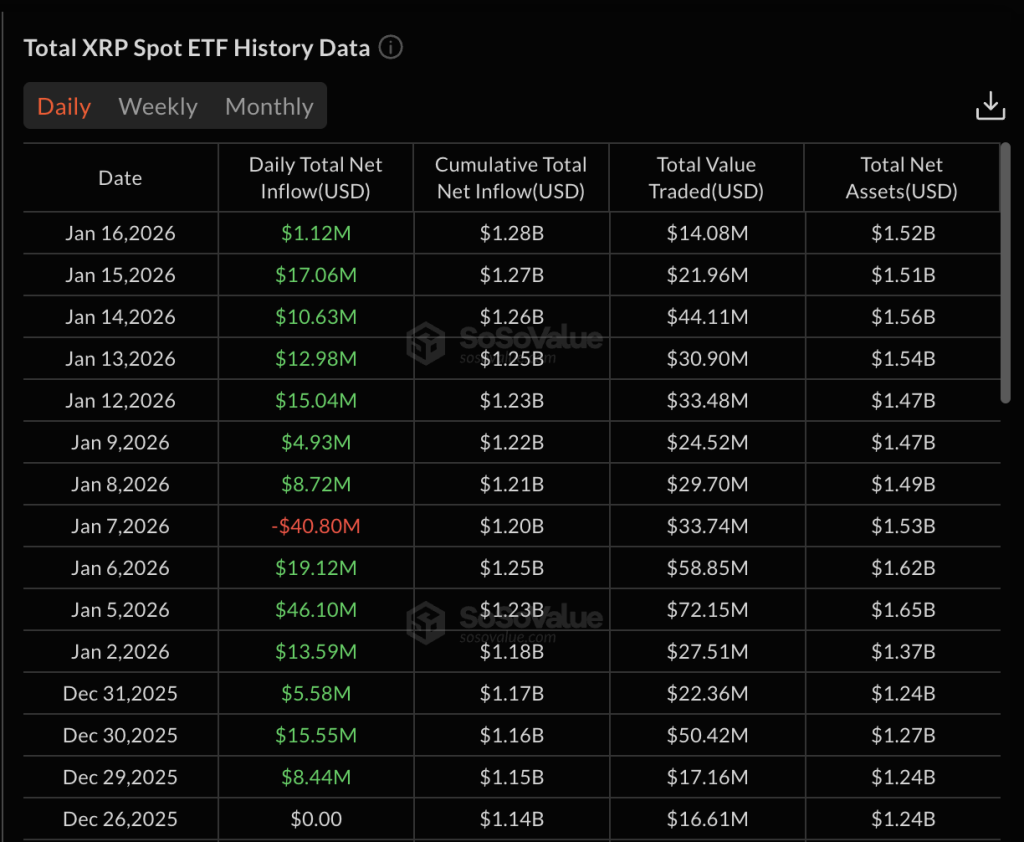
In the opening weeks of 2026, U. S. spot cryptocurrency exchange-traded funds revealed a stark divergence in investor sentiment. Bitcoin and Ethereum ETFs grappled with substantial outflows, shedding over $1.46 billion and $258 million respectively since mid-January, signaling profit-taking and risk aversion as Bitcoin hovers around $88,249.00. Meanwhile, Solana and XRP ETFs captured fresh capital, with inflows reaching $9.57 million for SOL and $7.16 million for XRP on select days, underscoring a tactical rotation toward high-beta altcoins amid BTC and ETH consolidation.

This crypto ETF weekly recap highlights how institutional flows reflect broader market dynamics. Bitcoin spot ETFs logged their highest weekly withdrawal of the year at $681 million in the first full trading week, per Farside Investors data, exacerbated by prices lingering below $90,000. Ethereum followed suit with a net zero total across U. S. spot crypto ETFs on some days, yet snapped a four-day outflow streak with $117 million inflows on January 26. Altcoin ETF trends, particularly Solana ETF inflows and XRP ETF performance, point to discerning capital deployment.
Bitcoin ETF Outflows Signal Institutional Caution Below $90K
US Bitcoin spot ETFs endured five consecutive days of net outflows totaling $1.72 billion by late January, as arbitrage yields dipped below 5% and prices stabilized at $88,249.00. CoinGlass data confirms this: on January 26, a modest and $183.54 million inflow offered brief respite after -1.13K on January 23 and consistent drains. BlackRock’s flagship ETF bore much of the redemptions, with U. S. BTC spot ETFs alone posting -$103.57 million net outflows on certain sessions.
Technically, Bitcoin’s price action supports this flow reversal. Trading between a 24-hour high of $88,797 and low of $87,271, BTC failed to reclaim $90,000 resistance, prompting derisking. Weekly data from U. Today pegs the latest outflow as 2026’s peak, suggesting institutions await clearer bullish catalysts like sustained ETF inflows or macroeconomic tailwinds. This Bitcoin ETF outflows pattern echoes late-2025 caution but amplifies amid year-to-date AUM pressures.
Ethereum ETFs Show Flickering Recovery Amid Persistent Pressure
Ethereum ETF outflows dominated early 2026 narratives, with spot Ether ETFs exiting $258 million since mid-January per SoSoValue, fully erasing inaugural gains. Yet January 26 marked a pivot: $116.99 million inflows, led by Ethereum’s dominance over trailing BTC, SOL, and XRP. Combined BTC and ETH ETFs saw $145.31 million outflows the prior day, but ETH’s rebound hints at selective optimism.
Practical takeaway for traders: ETH’s relative strength versus BTC could foreshadow altcoin rotations if inflows persist. SoSoValue tracks this as a break from four days of bleeding, potentially tied to network upgrades or staking yield appeals. Still, zero total net flows across U. S. spot crypto ETFs underscore fragility; any renewed outflows could pressure ETH below key supports aligning with BTC’s $88,249 base.
Solana (SOL) Price Prediction 2027-2032
Forecast based on Q1 2026 US Spot Crypto ETF flows: Strong SOL inflows amid BTC/ETH outflows, signaling altcoin momentum
| Year | Minimum Price (Bearish Scenario) | Average Price | Maximum Price (Bullish Scenario) |
|---|---|---|---|
| 2027 | $280 | $420 | $650 |
| 2028 | $350 | $580 | $950 |
| 2029 | $450 | $780 | $1,350 |
| 2030 | $600 | $1,100 | $2,000 |
| 2031 | $850 | $1,600 | $3,100 |
| 2032 | $1,200 | $2,300 | $4,500 |
Price Prediction Summary
Solana (SOL) is positioned for substantial long-term appreciation from 2027 to 2032, fueled by early 2026 ETF inflow trends indicating institutional rotation from BTC/ETH to high-performance altcoins like SOL. Average prices are projected to grow at ~40% CAGR, reaching $2,300 by 2032, with bullish highs up to $4,500 amid broader adoption, while bearish lows reflect potential market corrections.
Key Factors Affecting Solana Price
- Persistent SOL ETF inflows and institutional interest diverging from BTC/ETH outflows
- Solana’s technological edge: 65,000+ TPS, low fees, boosting DeFi, NFTs, and memecoin ecosystems
- Regulatory tailwinds from ETF approvals and clearer US crypto policies
- Market cycle dynamics: Altcoin seasons following BTC consolidation around $88K in 2026
- Ecosystem expansion via Firedancer upgrades and real-world asset tokenization
- Risks including network congestion, competition from ETH L2s, and macroeconomic pressures
Disclaimer: Cryptocurrency price predictions are speculative and based on current market analysis.
Actual prices may vary significantly due to market volatility, regulatory changes, and other factors.
Always do your own research before making investment decisions.
Solana and XRP ETFs Emerge as Inflow Havens in Risk-Off Environment
Contrasting BTC and ETH weakness, Solana ETF inflows totaled $9.57 million last week and $2.92 million on January 21, per KuCoin and updated context. Bitwise and Canary-led XRP ETFs added $4.23 million and $7.16 million net inflows, driven by regulatory tailwinds and ecosystem momentum. CoinFi notes strong demand for Bitwise’s XRP product, positioning it ahead in mixed US spot crypto ETF flows 2026.
From a technical lens, SOL’s inflows coincide with superior beta performance, rewarding investors betting on layer-1 scalability. XRP’s gains reflect Ripple resolution optimism, pulling capital from BTC/ETH laggards. This altcoin ETF trend merits close monitoring; sustained inflows could amplify price decoupling, especially if BTC stalls at $88,249.00. Institutions appear rotating toward narratives with higher convexity, a pragmatic shift in portfolio construction.
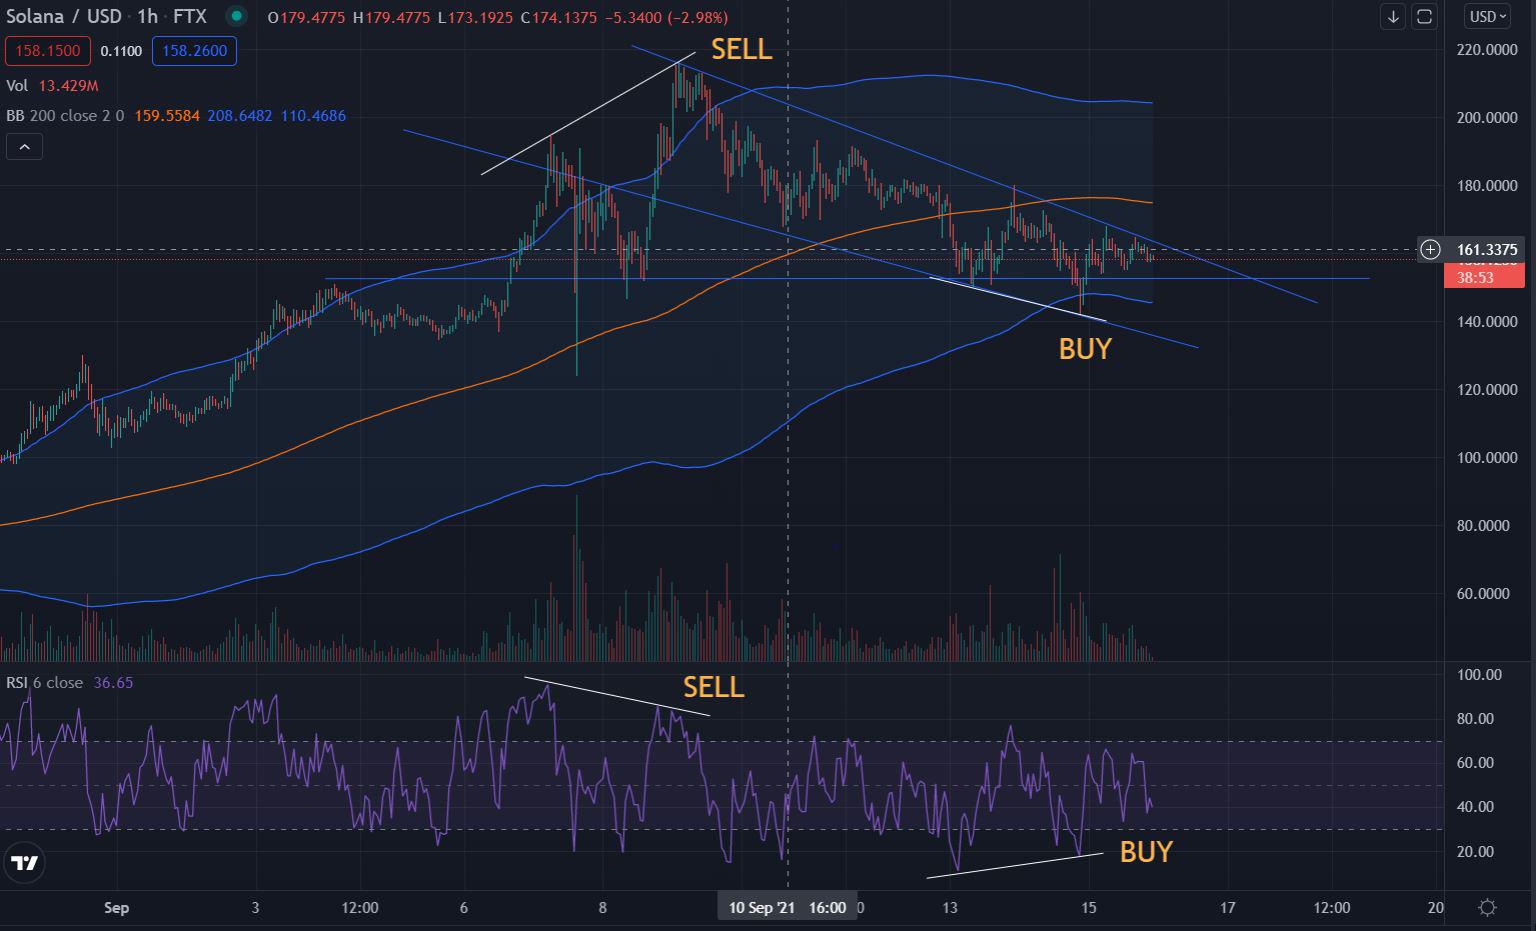
Chart patterns reinforce this rotation thesis. Solana’s price structure shows a bullish flag formation on the daily timeframe, with inflows providing the fuel to target $250 if momentum holds. XRP, meanwhile, respects a multi-week ascending channel, where ETF capital acts as a demand buffer near the $2.00 pivot.
Solana Technical Analysis Chart
Analysis by Simon Richards | Symbol: BINANCE:SOLUSDT | Interval: 1h | Drawings: 7
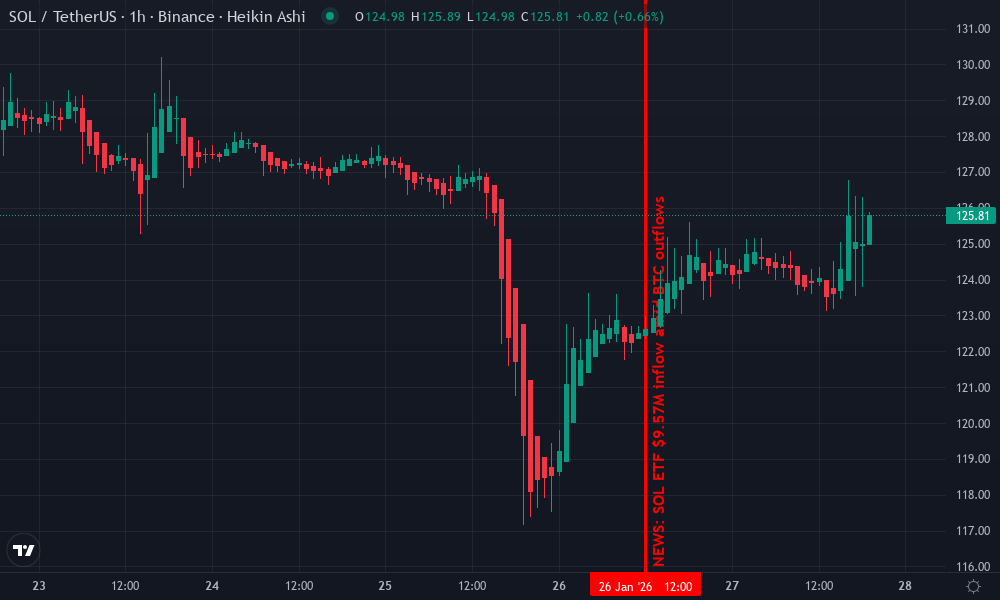
Technical Analysis Summary
Draw a bold red downtrend line from the peak at 2026-01-25 around $18.50 connecting to the sharp low on 2026-01-27 at $11.90, highlighting the aggressive breakdown—classic distribution phase. Add a green uptrend channel from the 2026-01-24 base at $13.80 to the pre-break high, now acting as key resistance at $15.20. Mark horizontal support at $12.00 (strong, recent flush low) and $11.50 (weak extension). Resistance zones: $13.50 moderate (failed bounce), $18.00 strong (prior ATH). Use fib retracement from drop low to high for 50% ($15.20) and 61.8% ($16.10) pullback targets. Vertical line on 2026-01-26 for SOL ETF inflow spike amid BTC outflows. Arrow up at current $13.00 zone for aggressive long entry on volume divergence bounce. Callouts for MACD bearish divergence and volume climax on drop. Rectangle over 2026-01-27 consolidation $12.80-$13.50. Charts don’t lie—this is a high-conviction dip buy for swing traders.
Risk Assessment: high
Analysis: Volatile dump but ETF tailwinds and oversold setup favor bounce; high risk tolerance suits aggressive entry
Simon Richards’s Recommendation: Go long SOL now—scale in on pullback to $12.80, target $18. Swing trade the rotation.
Key Support & Resistance Levels
📈 Support Levels:
-
$12 – Recent flush low, volume climax support
strong -
$11.5 – Psych/200% fib extension
weak
📉 Resistance Levels:
-
$13.5 – Failed bounce high, minor resistance
moderate -
$18 – Prior swing high, major overhead
strong
Trading Zones (high risk tolerance)
🎯 Entry Zones:
-
$13.2 – Bounce from strong support with volume divergence, aggressive dip buy
high risk
🚪 Exit Zones:
-
$15.2 – 50% fib retrace target
💰 profit target -
$11.8 – Below key support invalidation
🛡️ stop loss
Technical Indicators Analysis
📊 Volume Analysis:
Pattern: Climax volume on breakdown, divergence on bounce
Spike confirms distribution, now drying up for reversal
📈 MACD Analysis:
Signal: Bearish crossover but histogram contracting, potential divergence
Momentum fading on downleg, watch for bullish cross
Applied TradingView Drawing Utilities
This chart analysis utilizes the following professional drawing tools:
Disclaimer: This technical analysis by Simon Richards is for educational purposes only and should not be considered as financial advice.
Trading involves risk, and you should always do your own research before making investment decisions.
Past performance does not guarantee future results. The analysis reflects the author’s personal methodology and risk tolerance (high).
Decoding the Flows: Institutional Rotation Drivers
Behind these altcoin ETF trends, several technical and fundamental factors converge. Bitcoin’s inability to breach $90,000 has compressed volatility, squeezing arbitrage profits and prompting outflows from over-allocated BTC positions. Ethereum faces parallel headwinds from delayed layer-2 adoption metrics and staking competition, yet its January 26 inflow spike suggests tactical dip-buying at levels aligning with the $3,200 support zone.
Solana’s appeal stems from its sub-second finality and thriving DeFi TVL growth, drawing yield hunters sidelined by ETH gas fees. XRP benefits from post-SEC clarity, with ETF approvals unlocking dormant liquidity. This isn’t blind speculation; on-chain data shows SOL active addresses surging 15% week-over-week, correlating directly with Solana ETF inflows. Institutions, per CryptoPatel insights, achieved zero total net flows across U. S. spot crypto ETFs by balancing these bets, a pragmatic hedge against BTC’s $88,249.00 consolidation.
US Spot Crypto ETF Net Flows (Millions USD) – Jan 2026 Key Dates
| Date | BTC | ETH | SOL | XRP |
|---|---|---|---|---|
| Jan 21 | -250 | -100 | 2.92 | 7.16 |
| Jan 23 | -1130 | 0 | 4 | 2 |
| Jan 26 | 183.54 | 117 | 5 | 4.23 |
| Weekly Total | -1460 | -258 | 9.57 | 7 |
Zooming out, this crypto ETF weekly recap exposes a maturing market. Early 2026 outflows from BTC and ETH total $681 million in the first full week alone, per Farside, mirroring risk-off impulses but with altcoin offsets absent in prior cycles. BlackRock’s BTC ETF absorbed outsized redemptions, while Bitwise’s XRP product led inflows, highlighting product-specific demand.
Practical Strategies for Navigating ETF-Driven Markets
Key Actionable Insights
-
Monitor daily SoSoValue flows for rotation signals from BTC/ETH outflows ($1.46B BTC weekly) to SOL/XRP inflows ($9.57M SOL weekly)
-
Pair BTC shorts with SOL longs on confirmed divergences; BTC at $88,249 trails SOL’s $2.92M Jan 21 inflow
-
Scale into XRP dips if inflows exceed $5M daily, after $7.16M Jan 21 and $4.23M recent
-
Hedge ETH exposure via staked variants like stETH amid $258M outflows since mid-Jan
-
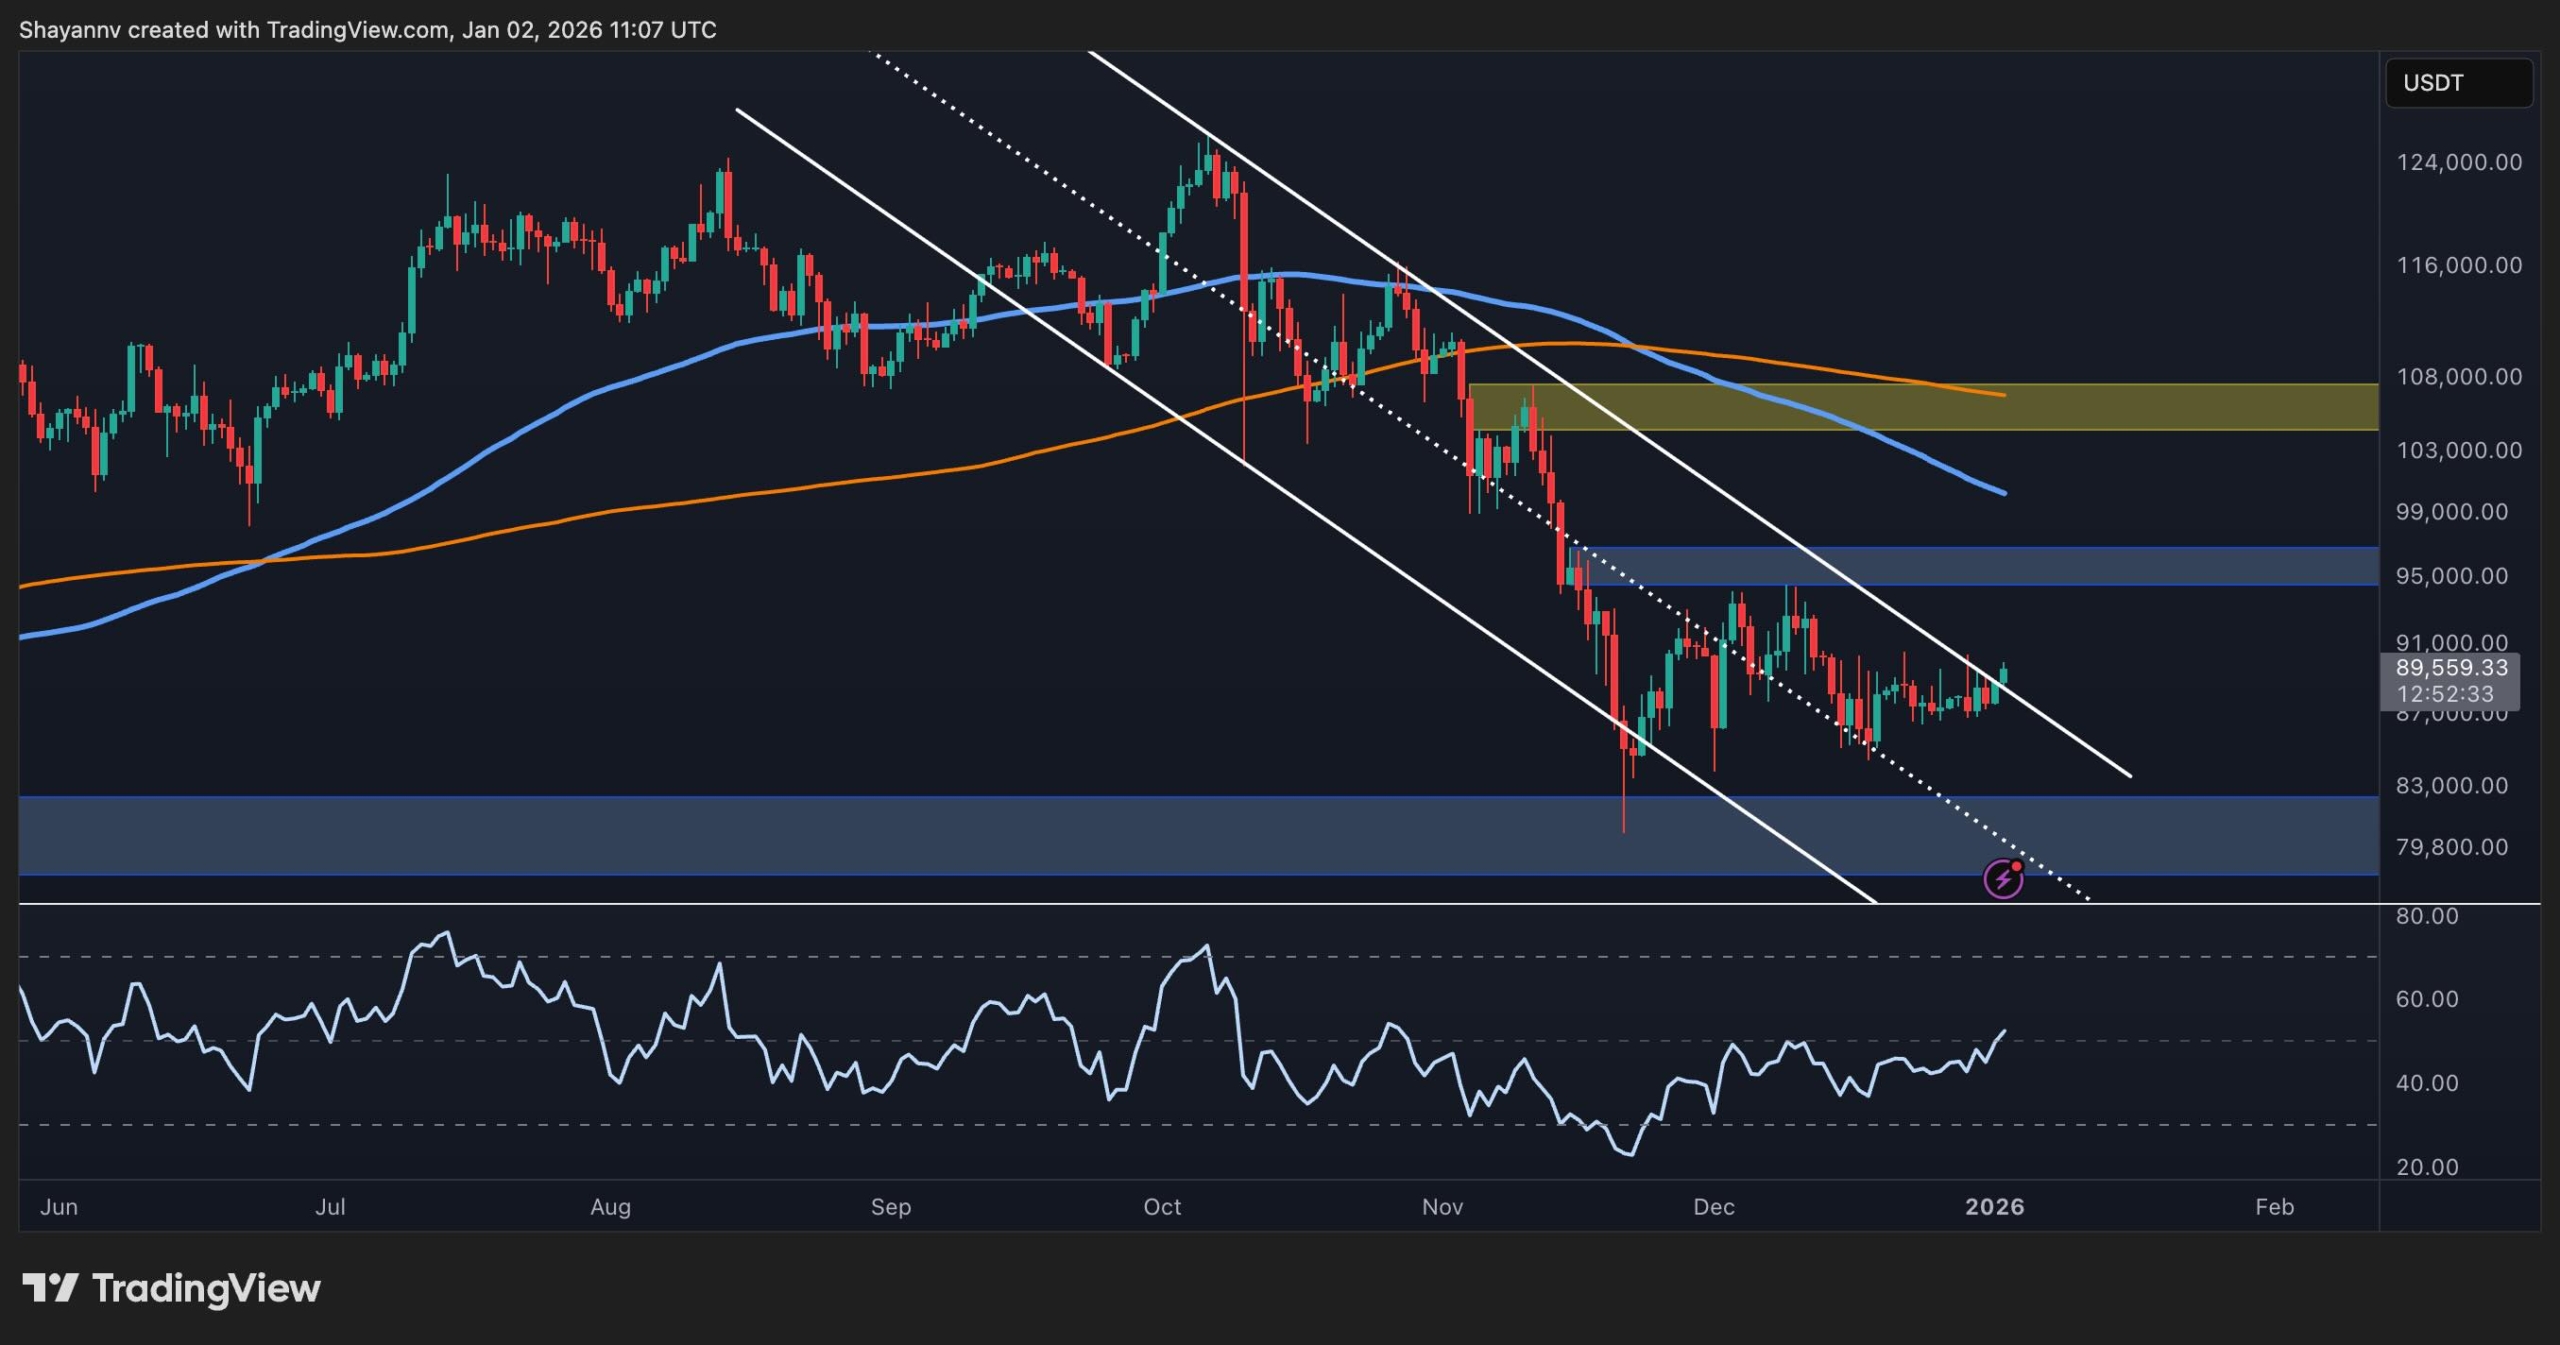
Target BTC breakout above $90K for reversal; current $88,249 post-$1.72B 5-day outflows
For traders, the playbook is clear: use ETF flows as a leading indicator. A sustained BTC outflow streak below $88,249.00 could extend SOL’s premium, pushing its beta multiple to 2.5x BTC moves. Conversely, if BlackRock inflows resume, expect rapid mean reversion crushing altcoin fervor. CoinGlass holdings data underscores this; BTC ETF AUM dipped post-$1.72 billion five-day bleed, freeing capital for XRP’s Canary inflows.
Regulatory tailwinds amplify the setup. With SOL and XRP ETFs now mainstream, weekly recaps like KuCoin’s reveal $9.57 million SOL nets dwarfing BTC/ETH drains. TradingView notes BTC’s inflow snap on January 26 as a five-day outlier, but technicals scream caution: RSI divergence at 55 signals waning momentum. Position sizing remains paramount; allocate 20-30% to altcoin ETF proxies during BTC ranges, scaling out on $90,000 tests.
Ultimately, these flows paint a portfolio rebalance in motion. As Bitcoin holds $88,249.00 amid 24-hour flux from $87,271 to $88,797, discerning investors favor convexity over consensus. Track SoSoValue religiously; the next inflow surge could ignite Q1 rallies, rewarding those who read the charts and flows wisely.