Recent surges in crypto ETF inflows are painting a bullish picture for Bitcoin (BTC), Ethereum (ETH), XRP, and Hedera (HBAR), signaling renewed investor confidence amid shifting market dynamics. While BTC and ETH ETFs have reclaimed momentum with their strongest weeks in months, XRP and HBAR are emerging as standout performers, drawing capital that hints at an broadening altcoin rally. This influx, totaling billions across products, underscores a strategic pivot toward diversified digital asset exposure.

Weekly and Recent Crypto ETF Inflows Summary (Jan 2026)
| Asset | Inflow Amount | Period/Details | % Change / Highlight | Source |
|---|---|---|---|---|
| BTC | $1.42B | Weekly, led by BlackRock IBIT ($1.03B) | Best week since October 📈 | CoinDesk |
| ETH | $479M | Weekly | Best week since October 📈 | CoinDesk |
| XRP | $17.06M | Jan 15 (daily, 6th straight day) | Record largest daily inflow; outperformed BTC, ETH, SOL 📈 | KuCoin |
| HBAR | $1.46M | Recent | 2026 high 📈 | BeInCrypto |
BTC and ETH ETFs Lead the Charge with Historic Inflows
Bitcoin ETFs kicked off 2026 with authority, absorbing $1.42 billion last week alone, the best performance since October. BlackRock’s IBIT dominated, pulling in $1.03 billion, while three-day inflows from January 13-15 hit $1.7 billion, reversing earlier hesitancy. Ethereum ETFs followed suit, attracting $479 million over the same period, with $219 million in a single standout day. These BTC ETF inflows and ETH counterparts reflect institutional appetites sharpening as macroeconomic tailwinds align.
Yet, this isn’t blind optimism. The data points to disciplined capital rotation: digital asset products overall saw $2.17 billion in net inflows, the highest weekly total since late 2025. Bitcoin reclaimed the top spot with $1.55 billion, edging out Ethereum’s $496 million. For portfolio strategists, this validates crypto ETFs as core diversification tools, blending liquidity with exposure to proven networks.
XRP ETFs Surge Ahead, Outpacing BTC and ETH
XRP ETFs are the undeniable breakout story, recording their largest daily inflow of $17.06 million on January 15,2026, their sixth consecutive day of gains. This outperformed BTC, ETH, and even Solana ETFs, accumulating nearly $991 million over 30 straight days and pushing total net assets to $1.18 billion. A 25% January price surge has positioned XRP as 2026’s hottest trade, per analysts, leaving Bitcoin in the dust for momentum.
This shift matters strategically. While BTC and ETH grappled with outflows on select days, like BTC’s $215.61 million dip on January 15 or $483.38 million on January 20, XRP’s streak highlights investor rotation toward utility-driven altcoins. Ripple’s ecosystem, bolstered by regulatory clarity, is channeling XRP ETF demand into real network growth, a pattern worth watching for balanced portfolios seeking alpha beyond majors.
HBAR ETF Demand Hits 2026 Peak Amid Price Setup
Hedera’s HBAR is quietly building a case for undervalued strength, with ETF inflows reaching 2026 highs at $1.46 million even as spot outflows spiked 150%. The HBAR price hovers near a critical W base at $0.102, testing resistance from the 50-day EMA around $0.127. This technical formation, coupled with rising ETF interest, suggests breakout potential if inflows sustain.
In a market favoring efficiency, Hedera’s hashgraph consensus offers enterprise-grade scalability, drawing institutional eyes. As BTC and ETH stabilize, HBAR’s HBAR ETF traction positions it as a strategic altcoin play, potentially amplifying broader crypto ETF bullish signals. Investors blending these flows into allocations could capture asymmetric upside in an evolving landscape.
These patterns across BTC ETF inflows, ETH, XRP, and HBAR reveal a maturing market where capital flows reward adaptability. Investors rotating from majors to high-utility altcoins like XRP and HBAR are betting on networks solving real-world friction, from cross-border payments to enterprise throughput. This isn’t mere speculation; it’s a calculated response to ETF products maturing into viable portfolio staples.
Decoding the Rally Signals: Inflows as Leading Indicators
Sustained crypto ETF inflows act as a powerful leading indicator, often preceding price rallies by weeks. Historical parallels abound: Bitcoin’s 2025 surge followed similar inflow spikes, while Ethereum’s climbs tracked ETH ETF launches. Now, XRP’s 30-day streak and HBAR’s peak demand echo that dynamic, suggesting altcoin season ETFs could fuel the next leg up. Spot outflows in BTC and ETH on certain days, like January 20’s $713 million combined exit, merely reflect profit-taking amid rotation, not conviction loss.
Fundamentally, these flows correlate with on-chain metrics. XRP Ledger activity has spiked alongside ETF gains, processing payments at scale, while Hedera’s council-backed governance attracts corporate treasuries. For BTC and ETH, renewed inflows stabilize bases, positioning them as anchors in diversified setups. Strategically, this confluence points to a multi-asset rally, where ignoring altcoin ETF momentum risks missing compounded returns.
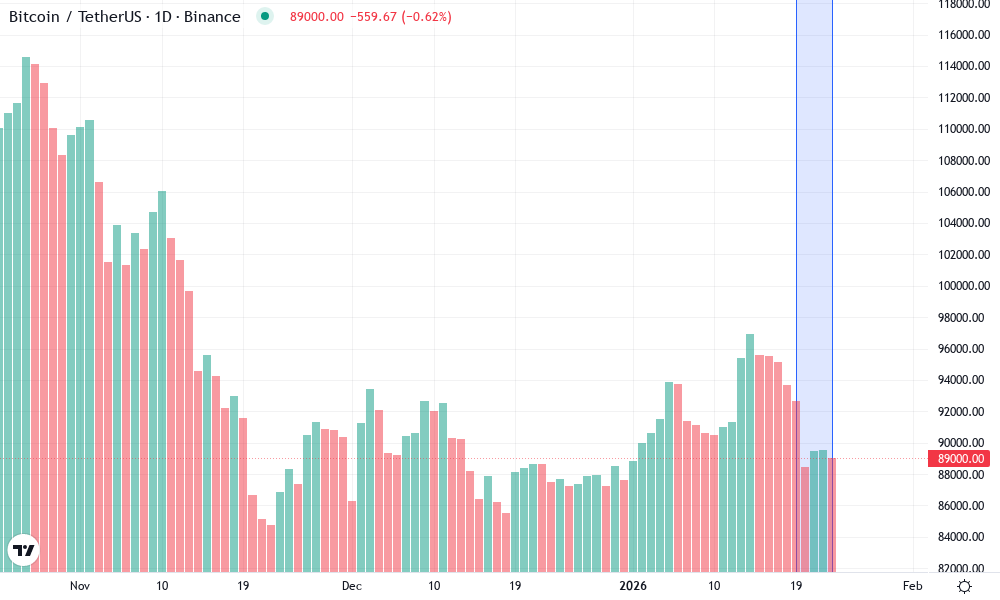
Bitcoin Technical Analysis Chart
Analysis by Lila Hartwell | Symbol: BINANCE:BTCUSDT | Interval: 1D | Drawings: 7
Technical Analysis Summary
Draw a prominent downtrend line connecting the swing high on 2026-01-05 at approximately 11,800 to the recent low on 2026-01-23 at 10,400, extending forward with moderate slope. Add horizontal support at 10,000 (recent lows), resistance at 11,200 (prior consolidation). Mark a descending channel with parallel lines from 11,800 high to 10,400 low, and upper channel from 11,500 to 11,000. Use fib retracement from the Dec peak drop: 0.618 at 10,800, 0.5 at 11,100. Volume callout on the sharp red candle drop mid-Jan highlighting distribution. MACD bearish crossover arrow down. Entry zone rectangle at 10,200-10,400 for long if holds support. Risk: medium due to ETF inflows supporting bounce.
Risk Assessment: medium
Analysis: Correction in bull trend supported by ETF flows, but high vol drop signals caution; medium tolerance suits waiting for confirmation
Lila Hartwell’s Recommendation: Hold core position, add on support hold for balanced portfolio growth
Key Support & Resistance Levels
📈 Support Levels:
-
$10,000 – Strong volume shelf from recent lows, aligns with psychological level and fib 0.786
strong -
$10,200 – Intermediate support from Jan consolidation
moderate
📉 Resistance Levels:
-
$11,200 – Prior swing high and channel top
strong -
$10,800 – Fib 0.618 retracement and recent rejection
moderate
Trading Zones (medium risk tolerance)
🎯 Entry Zones:
-
$10,300 – Dip buy near support if volume picks up, aligning with ETF inflow momentum
medium risk -
$10,550 – Break above minor resistance for confirmation long
low risk
🚪 Exit Zones:
-
$11,200 – Profit target at resistance/channel top
💰 profit target -
$9,900 – Stop below key support
🛡️ stop loss
Technical Indicators Analysis
📊 Volume Analysis:
Pattern: climax selling on drop, then drying up
High red volume on mid-Jan plunge indicates distribution, low volume recovery suggests basing
📈 MACD Analysis:
Signal: bearish crossover with histogram contracting
MACD line below signal, but momentum divergence on lows hints at potential reversal
Applied TradingView Drawing Utilities
This chart analysis utilizes the following professional drawing tools:
Disclaimer: This technical analysis by Lila Hartwell is for educational purposes only and should not be considered as financial advice.
Trading involves risk, and you should always do your own research before making investment decisions.
Past performance does not guarantee future results. The analysis reflects the author’s personal methodology and risk tolerance (medium).
Building Balanced Portfolios in the ETF Era
As a portfolio strategist, I view these crypto ETF bullish signals through a diversification lens. Allocate 5-10% to BTC and ETH ETFs for stability, layering in 2-5% XRP and HBAR for growth tilt. BlackRock’s IBIT exemplifies liquidity at scale, but XRP’s outperformance demands attention; its $1.18 billion assets under management rival emerging challengers. HBAR, at a fraction of peers’ valuations, offers convexity if that W pattern resolves upward.
Risk management remains paramount. Pair inflows data with volatility bands and macroeconomic overlays, like potential rate cuts boosting risk assets. This approach has historically outperformed lump-sum bets, preserving capital during outflows like January 15’s BTC dip. Crypto ETFs democratize access, turning opaque flows into actionable intelligence for long-term wealth building.
Forward projections align with this optimism. Standard Chartered eyes Bitcoin hitting new highs in 2026 and Ethereum at $40,000 by 2030, but altcoin ETF traction could accelerate those paths. XRP’s regulatory tailwinds and HBAR’s tech edge position them for outsized gains, potentially 3-5x from current levels if inflows persist.
Bitcoin (BTC) Price Prediction 2027-2032
Forecasts amid 2026 ETF inflow surge, new ATH, and institutional bullish signals (Current Year: 2026)
| Year | Minimum Price | Average Price | Maximum Price |
|---|---|---|---|
| 2027 | $180,000 | $250,000 | $350,000 |
| 2028 | $250,000 | $400,000 | $600,000 |
| 2029 | $350,000 | $600,000 | $950,000 |
| 2030 | $500,000 | $850,000 | $1,400,000 |
| 2031 | $650,000 | $1,100,000 | $1,800,000 |
| 2032 | $850,000 | $1,450,000 | $2,300,000 |
Price Prediction Summary
Bitcoin’s price is projected to see robust growth from 2027 to 2032, fueled by 2026’s record ETF inflows ($1.4B+ weekly) and new ATH. Average prices climb from $250K in 2027 to $1.45M by 2032, with min/max reflecting bearish (regulatory hurdles) to bullish (halving-driven rallies, adoption) scenarios. YoY avg growth ~35-40%, aligning with historical cycles.
Key Factors Affecting Bitcoin Price
- Surging 2026 ETF inflows ($1.7B+ in days, BlackRock leading) signaling institutional FOMO
- 2028 Bitcoin halving to reduce supply amid rising demand
- Regulatory tailwinds and clearer frameworks boosting confidence
- Technological resilience and Layer-2 scaling for broader use cases
- Macro shifts favoring risk assets post-2026 bull momentum
- Competition from ETH/XRP/HBAR ETFs but BTC’s dominance persists
Disclaimer: Cryptocurrency price predictions are speculative and based on current market analysis.
Actual prices may vary significantly due to market volatility, regulatory changes, and other factors.
Always do your own research before making investment decisions.
Monitoring weekly flows via trackers like SoSoValue will be key. As 2026 unfolds, expect rotation to refine further, with SOL and others vying for shares. Yet BTC, ETH, XRP, and HBAR’s current dominance underscores a bullish thesis: ETF inflows are reshaping crypto into a disciplined asset class, rewarding those who balance exposure across the spectrum.